Immigrants from Ethiopia vs Apache Unemployment Among Ages 60 to 64 years

COMPARE

Immigrants from Ethiopia
Race
Ancestry
AfghanAfricanAlaska NativeAlaskan AthabascanAlbanianAleutAlsatianAmericanArabArapahoArgentineanArmenianAssyrian/Chaldean/SyriacAustralianAustrianBahamianBangladeshiBarbadianBasqueBelgianBelizeanBermudanBhutaneseBlackfeetBolivianBrazilianBritishBritish West IndianBulgarianBurmeseCajunCambodianCanadianCape VerdeanCarpatho RusynCelticCentral AmericanCentral American IndianCherokeeCheyenneChickasawChileanChineseChippewaChoctawColombianColvilleComancheCosta RicanCreeCreekCroatianCrowCubanCypriotCzechCzechoslovakianDanishDelawareDominicanDutchDutch West IndianEastern EuropeanEcuadorianEgyptianEnglishEstonianEthiopianEuropeanFijianFilipinoFinnishFrenchFrench American IndianFrench CanadianGermanGerman RussianGhanaianGreekGuamanian/ChamorroGuatemalanGuyaneseHaitianHmongHonduranHopiHoumaHungarianIcelanderIndian (Asian)IndonesianInupiatIranianIraqiIrishIroquoisIsraeliItalianJamaicanJapaneseJordanianKenyanKiowaKoreanLaotianLatvianLebaneseLiberianLithuanianLumbeeLuxembourgerMacedonianMalaysianMalteseMarshalleseMenomineeMexicanMexican American IndianMongolianMoroccanNative HawaiianNavajoNepaleseNew ZealanderNicaraguanNigerianNorthern EuropeanNorwegianOkinawanOsageOttawaPaiutePakistaniPalestinianPanamanianParaguayanPennsylvania GermanPeruvianPimaPolishPortuguesePotawatomiPuebloPuerto RicanPuget Sound SalishRomanianRussianSalvadoranSamoanScandinavianScotch-IrishScottishSeminoleSenegaleseSerbianShoshoneSierra LeoneanSiouxSlavicSlovakSloveneSomaliSouth AfricanSouth AmericanSouth American IndianSoviet UnionSpaniardSpanishSpanish AmericanSpanish American IndianSri LankanSubsaharan AfricanSudaneseSwedishSwissSyrianTaiwaneseThaiTlingit-HaidaTohono O'OdhamTonganTrinidadian and TobagonianTsimshianTurkishU.S. Virgin IslanderUgandanUkrainianUruguayanUteVenezuelanVietnameseWelshWest IndianYakamaYaquiYugoslavianYumanYup'ikZimbabwean
Immigration
NonimmigrantsImmigrantsAfghanistanAfricaAlbaniaArgentinaArmeniaAsiaAustraliaAustriaBahamasBangladeshBarbadosBelarusBelgiumBelizeBoliviaBosnia and HerzegovinaBrazilBulgariaBurma/MyanmarCabo VerdeCambodiaCameroonCanadaCaribbeanCentral AmericaChileChinaColombiaCongoCosta RicaCroatiaCubaCzechoslovakiaDenmarkDominicaDominican RepublicEastern AfricaEastern AsiaEastern EuropeEcuadorEgyptEl SalvadorEnglandEritreaEthiopiaEuropeFijiFranceGermanyGhanaGreeceGrenadaGuatemalaGuyanaHaitiHondurasHong KongHungaryIndiaIndonesiaIranIraqIrelandIsraelItalyJamaicaJapanJordanKazakhstanKenyaKoreaKuwaitLaosLatin AmericaLatviaLebanonLiberiaLithuaniaMalaysiaMexicoMicronesiaMiddle AfricaMoldovaMoroccoNepalNetherlandsNicaraguaNigeriaNorth AmericaNorth MacedoniaNorthern AfricaNorthern EuropeNorwayOceaniaPakistanPanamaPeruPhilippinesPolandPortugalRomaniaRussiaSaudi ArabiaScotlandSenegalSerbiaSierra LeoneSingaporeSomaliaSouth AfricaSouth AmericaSouth Central AsiaSouth Eastern AsiaSouthern EuropeSpainSri LankaSt. Vincent and the GrenadinesSudanSwedenSwitzerlandSyriaTaiwanThailandTrinidad and TobagoTurkeyUgandaUkraineUruguayUzbekistanVenezuelaVietnamWest IndiesWestern AfricaWestern AsiaWestern EuropeYemenZaireZimbabweAzores
Apache
Race
Ancestry
AfghanAfricanAlaska NativeAlaskan AthabascanAlbanianAleutAlsatianAmericanApacheArabArapahoArgentineanArmenianAssyrian/Chaldean/SyriacAustralianAustrianBahamianBangladeshiBarbadianBasqueBelgianBelizeanBermudanBhutaneseBlackfeetBolivianBrazilianBritishBritish West IndianBulgarianBurmeseCajunCambodianCanadianCape VerdeanCarpatho RusynCelticCentral AmericanCentral American IndianCherokeeCheyenneChickasawChileanChineseChippewaChoctawColombianColvilleComancheCosta RicanCreeCreekCroatianCrowCubanCypriotCzechCzechoslovakianDanishDelawareDominicanDutchDutch West IndianEastern EuropeanEcuadorianEgyptianEnglishEstonianEthiopianEuropeanFijianFilipinoFinnishFrenchFrench American IndianFrench CanadianGermanGerman RussianGhanaianGreekGuamanian/ChamorroGuatemalanGuyaneseHaitianHmongHonduranHopiHoumaHungarianIcelanderIndian (Asian)IndonesianInupiatIranianIraqiIrishIroquoisIsraeliItalianJamaicanJapaneseJordanianKenyanKiowaKoreanLaotianLatvianLebaneseLiberianLithuanianLumbeeLuxembourgerMacedonianMalaysianMalteseMarshalleseMenomineeMexicanMexican American IndianMongolianMoroccanNative HawaiianNavajoNepaleseNew ZealanderNicaraguanNigerianNorthern EuropeanNorwegianOkinawanOsageOttawaPaiutePakistaniPalestinianPanamanianParaguayanPennsylvania GermanPeruvianPimaPolishPortuguesePotawatomiPuebloPuerto RicanPuget Sound SalishRomanianRussianSalvadoranSamoanScandinavianScotch-IrishScottishSeminoleSenegaleseSerbianShoshoneSierra LeoneanSiouxSlavicSlovakSloveneSomaliSouth AfricanSouth AmericanSouth American IndianSoviet UnionSpaniardSpanishSpanish AmericanSpanish American IndianSri LankanSubsaharan AfricanSudaneseSwedishSwissSyrianTaiwaneseThaiTlingit-HaidaTohono O'OdhamTonganTrinidadian and TobagonianTsimshianTurkishU.S. Virgin IslanderUgandanUkrainianUruguayanUteVenezuelanVietnameseWelshWest IndianYakamaYaquiYugoslavianYumanYup'ikZimbabwean
Immigration
NonimmigrantsImmigrantsAfghanistanAfricaAlbaniaArgentinaArmeniaAsiaAustraliaAustriaBahamasBangladeshBarbadosBelarusBelgiumBelizeBoliviaBosnia and HerzegovinaBrazilBulgariaBurma/MyanmarCabo VerdeCambodiaCameroonCanadaCaribbeanCentral AmericaChileChinaColombiaCongoCosta RicaCroatiaCubaCzechoslovakiaDenmarkDominicaDominican RepublicEastern AfricaEastern AsiaEastern EuropeEcuadorEgyptEl SalvadorEnglandEritreaEuropeFijiFranceGermanyGhanaGreeceGrenadaGuatemalaGuyanaHaitiHondurasHong KongHungaryIndiaIndonesiaIranIraqIrelandIsraelItalyJamaicaJapanJordanKazakhstanKenyaKoreaKuwaitLaosLatin AmericaLatviaLebanonLiberiaLithuaniaMalaysiaMexicoMicronesiaMiddle AfricaMoldovaMoroccoNepalNetherlandsNicaraguaNigeriaNorth AmericaNorth MacedoniaNorthern AfricaNorthern EuropeNorwayOceaniaPakistanPanamaPeruPhilippinesPolandPortugalRomaniaRussiaSaudi ArabiaScotlandSenegalSerbiaSierra LeoneSingaporeSomaliaSouth AfricaSouth AmericaSouth Central AsiaSouth Eastern AsiaSouthern EuropeSpainSri LankaSt. Vincent and the GrenadinesSudanSwedenSwitzerlandSyriaTaiwanThailandTrinidad and TobagoTurkeyUgandaUkraineUruguayUzbekistanVenezuelaVietnamWest IndiesWestern AfricaWestern AsiaWestern EuropeYemenZaireZimbabweAzores
Unemployment Among Ages 60 to 64 years
Income
Poverty
Unemployment
Labor Participation
Family Structure
Vehicle Availability
Education Level
Disability

Unemployment Among Ages 60 to 64 years Comparison

Immigrants from Ethiopia

Apache

Excellent
Tragic
4.8%
UNEMPLOYMENT AMONG AGES 60 TO 64 YEARS
85.3/ 100
METRIC RATING
142nd/ 347
METRIC RANK
6.0%
UNEMPLOYMENT AMONG AGES 60 TO 64 YEARS
0.0/ 100
METRIC RATING
328th/ 347
METRIC RANK

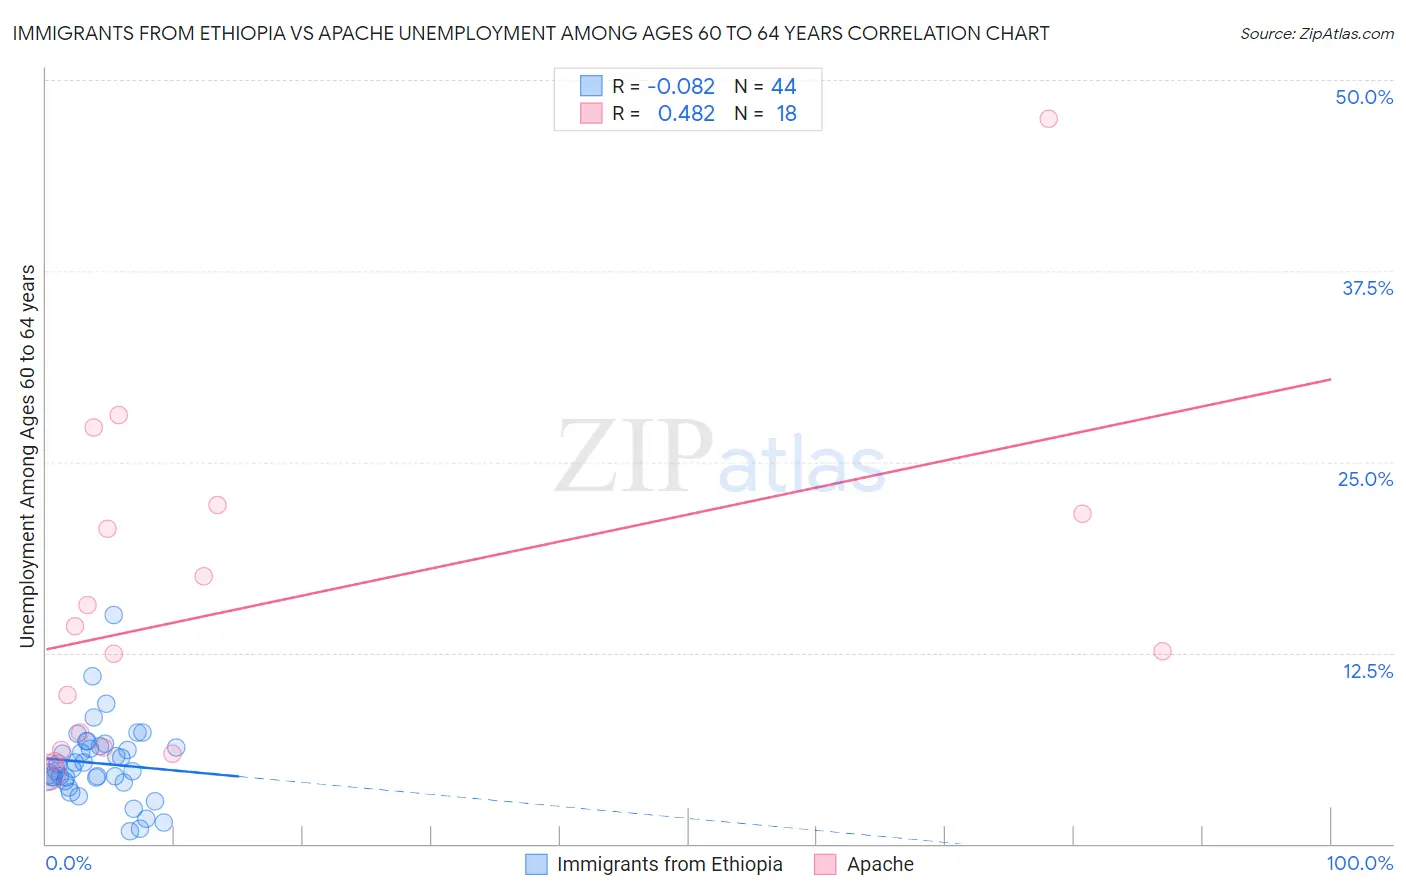
Immigrants from Ethiopia vs Apache Unemployment Among Ages 60 to 64 years Correlation Chart

The statistical analysis conducted on geographies consisting of 200,053,248 people shows a slight negative correlation between the proportion of Immigrants from Ethiopia and unemployment rate among population between the ages 60 and 64 in the United States with a correlation coefficient (R) of -0.082 and weighted average of 4.8%. Similarly, the statistical analysis conducted on geographies consisting of 214,919,581 people shows a moderate positive correlation between the proportion of Apache and unemployment rate among population between the ages 60 and 64 in the United States with a correlation coefficient (R) of 0.482 and weighted average of 6.0%, a difference of 24.4%.
Immigrants from Ethiopia vs Apache Unemployment Among Ages 60 to 64 years

Unemployment Among Ages 60 to 64 years Correlation Summary

MeasurementImmigrants from EthiopiaApache
Minimum0.80%4.6%
Maximum15.0%47.5%
Range14.2%42.9%
Mean5.3%15.8%
Median4.8%13.4%
Interquartile 25% (IQ1)4.2%6.3%
Interquartile 75% (IQ3)6.4%21.6%
Interquartile Range (IQR)2.1%15.3%
Standard Deviation (Sample)2.5%10.9%
Standard Deviation (Population)2.5%10.6%

Similar Demographics by Unemployment Among Ages 60 to 64 years

Demographics Similar to Immigrants from Ethiopia by Unemployment Among Ages 60 to 64 years

In terms of unemployment among ages 60 to 64 years, the demographic groups most similar to Immigrants from Ethiopia are Panamanian (4.8%, a difference of 0.010%), Italian (4.8%, a difference of 0.020%), Pima (4.8%, a difference of 0.030%), Immigrants from Lithuania (4.8%, a difference of 0.10%), and Immigrants from Africa (4.8%, a difference of 0.10%).
DemographicsRating | RankUnemployment Among Ages 60 to 64 years
Pennsylvania Germans
87.8
/100
|
#135
Excellent
4.8%
French Canadians
87.6
/100
|
#136
Excellent
4.8%
Cambodians
86.9
/100
|
#137
Excellent
4.8%
Immigrants | Lithuania
86.7
/100
|
#138
Excellent
4.8%
Immigrants | Africa
86.6
/100
|
#139
Excellent
4.8%
Pima
85.8
/100
|
#140
Excellent
4.8%
Panamanians
85.5
/100
|
#141
Excellent
4.8%
Immigrants | Ethiopia
85.3
/100
|
#142
Excellent
4.8%
Italians
85.0
/100
|
#143
Excellent
4.8%
Immigrants | Pakistan
83.3
/100
|
#144
Excellent
4.8%
Burmese
83.1
/100
|
#145
Excellent
4.8%
Turks
81.9
/100
|
#146
Excellent
4.8%
Mongolians
81.2
/100
|
#147
Excellent
4.8%
Latvians
79.1
/100
|
#148
Good
4.8%
Arabs
78.8
/100
|
#149
Good
4.8%

Demographics Similar to Apache by Unemployment Among Ages 60 to 64 years

In terms of unemployment among ages 60 to 64 years, the demographic groups most similar to Apache are Immigrants from Bangladesh (6.0%, a difference of 0.010%), Immigrants from Armenia (6.0%, a difference of 0.27%), Yakama (6.0%, a difference of 0.40%), Dominican (6.0%, a difference of 0.43%), and Immigrants from Dominican Republic (6.0%, a difference of 0.78%).
DemographicsRating | RankUnemployment Among Ages 60 to 64 years
Dutch West Indians
0.0
/100
|
#321
Tragic
5.7%
Ecuadorians
0.0
/100
|
#322
Tragic
5.8%
Alsatians
0.0
/100
|
#323
Tragic
5.8%
Immigrants | Ecuador
0.0
/100
|
#324
Tragic
5.8%
Paiute
0.0
/100
|
#325
Tragic
5.8%
Immigrants | St. Vincent and the Grenadines
0.0
/100
|
#326
Tragic
5.9%
Immigrants | Grenada
0.0
/100
|
#327
Tragic
5.9%
Apache
0.0
/100
|
#328
Tragic
6.0%
Immigrants | Bangladesh
0.0
/100
|
#329
Tragic
6.0%
Immigrants | Armenia
0.0
/100
|
#330
Tragic
6.0%
Yakama
0.0
/100
|
#331
Tragic
6.0%
Dominicans
0.0
/100
|
#332
Tragic
6.0%
Immigrants | Dominican Republic
0.0
/100
|
#333
Tragic
6.0%
Puerto Ricans
0.0
/100
|
#334
Tragic
6.1%
Vietnamese
0.0
/100
|
#335
Tragic
6.1%