Immigrants from Eritrea vs Yuman Unemployment Among Seniors over 65 years
COMPARE
Immigrants from Eritrea
Yuman
Unemployment Among Seniors over 65 years
Unemployment Among Seniors over 65 years Comparison
Immigrants from Eritrea
Yuman
4.7%
UNEMPLOYMENT AMONG SENIORS OVER 65 YEARS
100.0/ 100
METRIC RATING
18th/ 347
METRIC RANK
5.8%
UNEMPLOYMENT AMONG SENIORS OVER 65 YEARS
0.0/ 100
METRIC RATING
324th/ 347
METRIC RANK
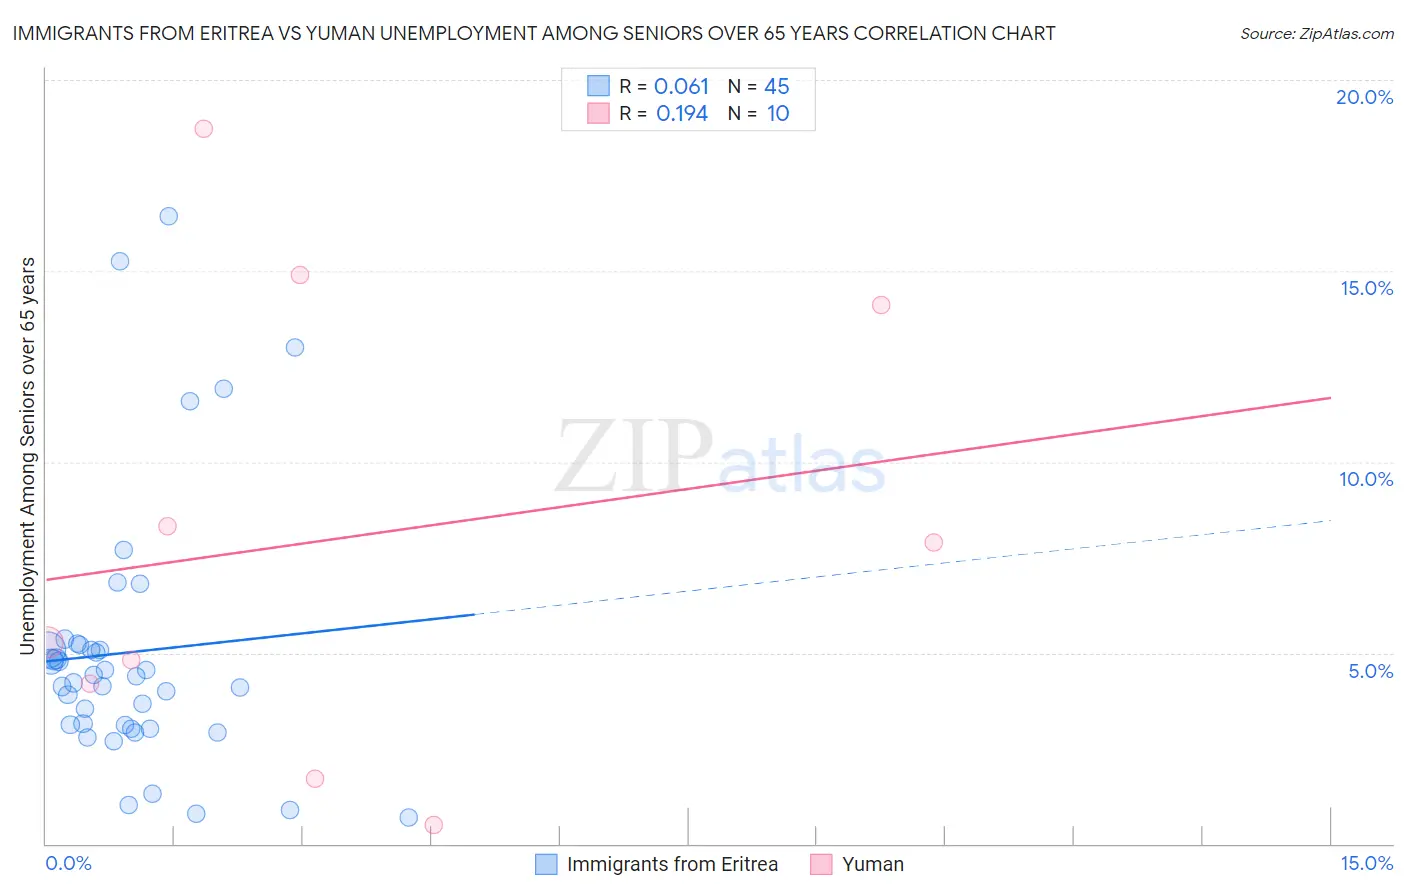
Immigrants from Eritrea vs Yuman Unemployment Among Seniors over 65 years Correlation Chart
The statistical analysis conducted on geographies consisting of 102,013,248 people shows a slight positive correlation between the proportion of Immigrants from Eritrea and unemployment rate amomg seniors over the age of 65 in the United States with a correlation coefficient (R) of 0.061 and weighted average of 4.7%. Similarly, the statistical analysis conducted on geographies consisting of 39,235,005 people shows a poor positive correlation between the proportion of Yuman and unemployment rate amomg seniors over the age of 65 in the United States with a correlation coefficient (R) of 0.194 and weighted average of 5.8%, a difference of 24.7%.
Unemployment Among Seniors over 65 years Correlation Summary
| Measurement | Immigrants from Eritrea | Yuman |
| Minimum | 0.70% | 0.50% |
| Maximum | 16.4% | 18.7% |
| Range | 15.7% | 18.2% |
| Mean | 5.0% | 8.0% |
| Median | 4.4% | 6.6% |
| Interquartile 25% (IQ1) | 3.1% | 4.2% |
| Interquartile 75% (IQ3) | 5.2% | 14.1% |
| Interquartile Range (IQR) | 2.1% | 9.9% |
| Standard Deviation (Sample) | 3.5% | 6.0% |
| Standard Deviation (Population) | 3.5% | 5.7% |
Similar Demographics by Unemployment Among Seniors over 65 years
Demographics Similar to Immigrants from Eritrea by Unemployment Among Seniors over 65 years
In terms of unemployment among seniors over 65 years, the demographic groups most similar to Immigrants from Eritrea are Creek (4.6%, a difference of 0.29%), Immigrants from Burma/Myanmar (4.6%, a difference of 0.40%), Lumbee (4.6%, a difference of 0.41%), Menominee (4.6%, a difference of 0.48%), and Lebanese (4.7%, a difference of 0.59%).
| Demographics | Rating | Rank | Unemployment Among Seniors over 65 years |
| Comanche | 100.0 /100 | #11 | Exceptional 4.6% |
| Osage | 100.0 /100 | #12 | Exceptional 4.6% |
| Cubans | 100.0 /100 | #13 | Exceptional 4.6% |
| Menominee | 100.0 /100 | #14 | Exceptional 4.6% |
| Lumbee | 100.0 /100 | #15 | Exceptional 4.6% |
| Immigrants | Burma/Myanmar | 100.0 /100 | #16 | Exceptional 4.6% |
| Creek | 100.0 /100 | #17 | Exceptional 4.6% |
| Immigrants | Eritrea | 100.0 /100 | #18 | Exceptional 4.7% |
| Lebanese | 100.0 /100 | #19 | Exceptional 4.7% |
| Immigrants | Nepal | 100.0 /100 | #20 | Exceptional 4.7% |
| Norwegians | 100.0 /100 | #21 | Exceptional 4.7% |
| Czechs | 100.0 /100 | #22 | Exceptional 4.7% |
| Kenyans | 100.0 /100 | #23 | Exceptional 4.7% |
| Iraqis | 100.0 /100 | #24 | Exceptional 4.7% |
| Tongans | 100.0 /100 | #25 | Exceptional 4.7% |
Demographics Similar to Yuman by Unemployment Among Seniors over 65 years
In terms of unemployment among seniors over 65 years, the demographic groups most similar to Yuman are Immigrants from Dominica (5.8%, a difference of 0.18%), Native/Alaskan (5.8%, a difference of 0.51%), Inupiat (5.8%, a difference of 0.57%), British West Indian (5.8%, a difference of 0.59%), and Shoshone (5.9%, a difference of 1.0%).
| Demographics | Rating | Rank | Unemployment Among Seniors over 65 years |
| Immigrants | Bahamas | 0.0 /100 | #317 | Tragic 5.7% |
| Vietnamese | 0.0 /100 | #318 | Tragic 5.7% |
| Immigrants | Bangladesh | 0.0 /100 | #319 | Tragic 5.7% |
| Immigrants | Mexico | 0.0 /100 | #320 | Tragic 5.7% |
| British West Indians | 0.0 /100 | #321 | Tragic 5.8% |
| Natives/Alaskans | 0.0 /100 | #322 | Tragic 5.8% |
| Immigrants | Dominica | 0.0 /100 | #323 | Tragic 5.8% |
| Yuman | 0.0 /100 | #324 | Tragic 5.8% |
| Inupiat | 0.0 /100 | #325 | Tragic 5.8% |
| Shoshone | 0.0 /100 | #326 | Tragic 5.9% |
| Bermudans | 0.0 /100 | #327 | Tragic 5.9% |
| Puerto Ricans | 0.0 /100 | #328 | Tragic 5.9% |
| Dominicans | 0.0 /100 | #329 | Tragic 6.0% |
| Immigrants | Portugal | 0.0 /100 | #330 | Tragic 6.0% |
| Taiwanese | 0.0 /100 | #331 | Tragic 6.0% |