Immigrants from England vs Jordanian Unemployment Among Ages 35 to 44 years

COMPARE

Immigrants from England
Race
Ancestry
AfghanAfricanAlaska NativeAlaskan AthabascanAlbanianAleutAlsatianAmericanApacheArabArapahoArgentineanArmenianAssyrian/Chaldean/SyriacAustralianAustrianBahamianBangladeshiBarbadianBasqueBelgianBelizeanBermudanBhutaneseBlackfeetBolivianBrazilianBritishBritish West IndianBulgarianBurmeseCajunCambodianCanadianCape VerdeanCarpatho RusynCelticCentral AmericanCentral American IndianCherokeeCheyenneChickasawChileanChineseChippewaChoctawColombianColvilleComancheCosta RicanCreeCreekCroatianCrowCubanCypriotCzechCzechoslovakianDanishDelawareDominicanDutchDutch West IndianEastern EuropeanEcuadorianEgyptianEnglishEstonianEthiopianEuropeanFijianFilipinoFinnishFrenchFrench American IndianFrench CanadianGermanGerman RussianGhanaianGreekGuamanian/ChamorroGuatemalanGuyaneseHaitianHmongHonduranHopiHoumaHungarianIcelanderIndian (Asian)IndonesianInupiatIranianIraqiIrishIroquoisIsraeliItalianJamaicanJapaneseKenyanKiowaKoreanLaotianLatvianLebaneseLiberianLithuanianLumbeeLuxembourgerMacedonianMalaysianMalteseMarshalleseMenomineeMexicanMexican American IndianMongolianMoroccanNative HawaiianNavajoNepaleseNew ZealanderNicaraguanNigerianNorthern EuropeanNorwegianOkinawanOsageOttawaPaiutePakistaniPalestinianPanamanianParaguayanPennsylvania GermanPeruvianPimaPolishPortuguesePotawatomiPuebloPuerto RicanPuget Sound SalishRomanianRussianSalvadoranSamoanScandinavianScotch-IrishScottishSeminoleSenegaleseSerbianShoshoneSierra LeoneanSiouxSlavicSlovakSloveneSomaliSouth AfricanSouth AmericanSouth American IndianSoviet UnionSpaniardSpanishSpanish AmericanSpanish American IndianSri LankanSubsaharan AfricanSudaneseSwedishSwissSyrianTaiwaneseThaiTlingit-HaidaTohono O'OdhamTonganTrinidadian and TobagonianTsimshianTurkishU.S. Virgin IslanderUgandanUkrainianUruguayanUteVenezuelanVietnameseWelshWest IndianYakamaYaquiYugoslavianYumanYup'ikZimbabwean
Immigration
NonimmigrantsImmigrantsAfghanistanAfricaAlbaniaArgentinaArmeniaAsiaAustraliaAustriaBahamasBangladeshBarbadosBelarusBelgiumBelizeBoliviaBosnia and HerzegovinaBrazilBulgariaBurma/MyanmarCabo VerdeCambodiaCameroonCanadaCaribbeanCentral AmericaChileChinaColombiaCongoCosta RicaCroatiaCubaCzechoslovakiaDenmarkDominicaDominican RepublicEastern AfricaEastern AsiaEastern EuropeEcuadorEgyptEl SalvadorEnglandEritreaEthiopiaEuropeFijiFranceGermanyGhanaGreeceGrenadaGuatemalaGuyanaHaitiHondurasHong KongHungaryIndiaIndonesiaIranIraqIrelandIsraelItalyJamaicaJapanJordanKazakhstanKenyaKoreaKuwaitLaosLatin AmericaLatviaLebanonLiberiaLithuaniaMalaysiaMexicoMicronesiaMiddle AfricaMoldovaMoroccoNepalNetherlandsNicaraguaNigeriaNorth AmericaNorth MacedoniaNorthern AfricaNorthern EuropeNorwayOceaniaPakistanPanamaPeruPhilippinesPolandPortugalRomaniaRussiaSaudi ArabiaScotlandSenegalSerbiaSierra LeoneSingaporeSomaliaSouth AfricaSouth AmericaSouth Central AsiaSouth Eastern AsiaSouthern EuropeSpainSri LankaSt. Vincent and the GrenadinesSudanSwedenSwitzerlandSyriaTaiwanThailandTrinidad and TobagoTurkeyUgandaUkraineUruguayUzbekistanVenezuelaVietnamWest IndiesWestern AfricaWestern AsiaWestern EuropeYemenZaireZimbabweAzores
Jordanian
Race
Ancestry
AfghanAfricanAlaska NativeAlaskan AthabascanAlbanianAleutAlsatianAmericanApacheArabArapahoArgentineanArmenianAssyrian/Chaldean/SyriacAustralianAustrianBahamianBangladeshiBarbadianBasqueBelgianBelizeanBermudanBhutaneseBlackfeetBolivianBrazilianBritishBritish West IndianBulgarianBurmeseCajunCambodianCanadianCape VerdeanCarpatho RusynCelticCentral AmericanCentral American IndianCherokeeCheyenneChickasawChileanChineseChippewaChoctawColombianColvilleComancheCosta RicanCreeCreekCroatianCrowCubanCypriotCzechCzechoslovakianDanishDelawareDominicanDutchDutch West IndianEastern EuropeanEcuadorianEgyptianEnglishEstonianEthiopianEuropeanFijianFilipinoFinnishFrenchFrench American IndianFrench CanadianGermanGerman RussianGhanaianGreekGuamanian/ChamorroGuatemalanGuyaneseHaitianHmongHonduranHopiHoumaHungarianIcelanderIndian (Asian)IndonesianInupiatIranianIraqiIrishIroquoisIsraeliItalianJamaicanJapaneseJordanianKenyanKiowaKoreanLaotianLatvianLebaneseLiberianLithuanianLumbeeLuxembourgerMacedonianMalaysianMalteseMarshalleseMenomineeMexicanMexican American IndianMongolianMoroccanNative HawaiianNavajoNepaleseNew ZealanderNicaraguanNigerianNorthern EuropeanNorwegianOkinawanOsageOttawaPaiutePakistaniPalestinianPanamanianParaguayanPennsylvania GermanPeruvianPimaPolishPortuguesePotawatomiPuebloPuerto RicanPuget Sound SalishRomanianRussianSalvadoranSamoanScandinavianScotch-IrishScottishSeminoleSenegaleseSerbianShoshoneSierra LeoneanSiouxSlavicSlovakSloveneSomaliSouth AfricanSouth AmericanSouth American IndianSoviet UnionSpaniardSpanishSpanish AmericanSpanish American IndianSri LankanSubsaharan AfricanSudaneseSwedishSwissSyrianTaiwaneseThaiTlingit-HaidaTohono O'OdhamTonganTrinidadian and TobagonianTsimshianTurkishU.S. Virgin IslanderUgandanUkrainianUruguayanUteVenezuelanVietnameseWelshWest IndianYakamaYaquiYugoslavianYumanYup'ikZimbabwean
Immigration
NonimmigrantsImmigrantsAfghanistanAfricaAlbaniaArgentinaArmeniaAsiaAustraliaAustriaBahamasBangladeshBarbadosBelarusBelgiumBelizeBoliviaBosnia and HerzegovinaBrazilBulgariaBurma/MyanmarCabo VerdeCambodiaCameroonCanadaCaribbeanCentral AmericaChileChinaColombiaCongoCosta RicaCroatiaCubaCzechoslovakiaDenmarkDominicaDominican RepublicEastern AfricaEastern AsiaEastern EuropeEcuadorEgyptEl SalvadorEritreaEthiopiaEuropeFijiFranceGermanyGhanaGreeceGrenadaGuatemalaGuyanaHaitiHondurasHong KongHungaryIndiaIndonesiaIranIraqIrelandIsraelItalyJamaicaJapanJordanKazakhstanKenyaKoreaKuwaitLaosLatin AmericaLatviaLebanonLiberiaLithuaniaMalaysiaMexicoMicronesiaMiddle AfricaMoldovaMoroccoNepalNetherlandsNicaraguaNigeriaNorth AmericaNorth MacedoniaNorthern AfricaNorthern EuropeNorwayOceaniaPakistanPanamaPeruPhilippinesPolandPortugalRomaniaRussiaSaudi ArabiaScotlandSenegalSerbiaSierra LeoneSingaporeSomaliaSouth AfricaSouth AmericaSouth Central AsiaSouth Eastern AsiaSouthern EuropeSpainSri LankaSt. Vincent and the GrenadinesSudanSwedenSwitzerlandSyriaTaiwanThailandTrinidad and TobagoTurkeyUgandaUkraineUruguayUzbekistanVenezuelaVietnamWest IndiesWestern AfricaWestern AsiaWestern EuropeYemenZaireZimbabweAzores
Unemployment Among Ages 35 to 44 years
Income
Poverty
Unemployment
Labor Participation
Family Structure
Vehicle Availability
Education Level
Disability

Unemployment Among Ages 35 to 44 years Comparison

Immigrants from England

Jordanians

Good
Exceptional
4.6%
UNEMPLOYMENT AMONG AGES 35 TO 44 YEARS
70.5/ 100
METRIC RATING
150th/ 347
METRIC RANK
4.3%
UNEMPLOYMENT AMONG AGES 35 TO 44 YEARS
99.0/ 100
METRIC RATING
34th/ 347
METRIC RANK

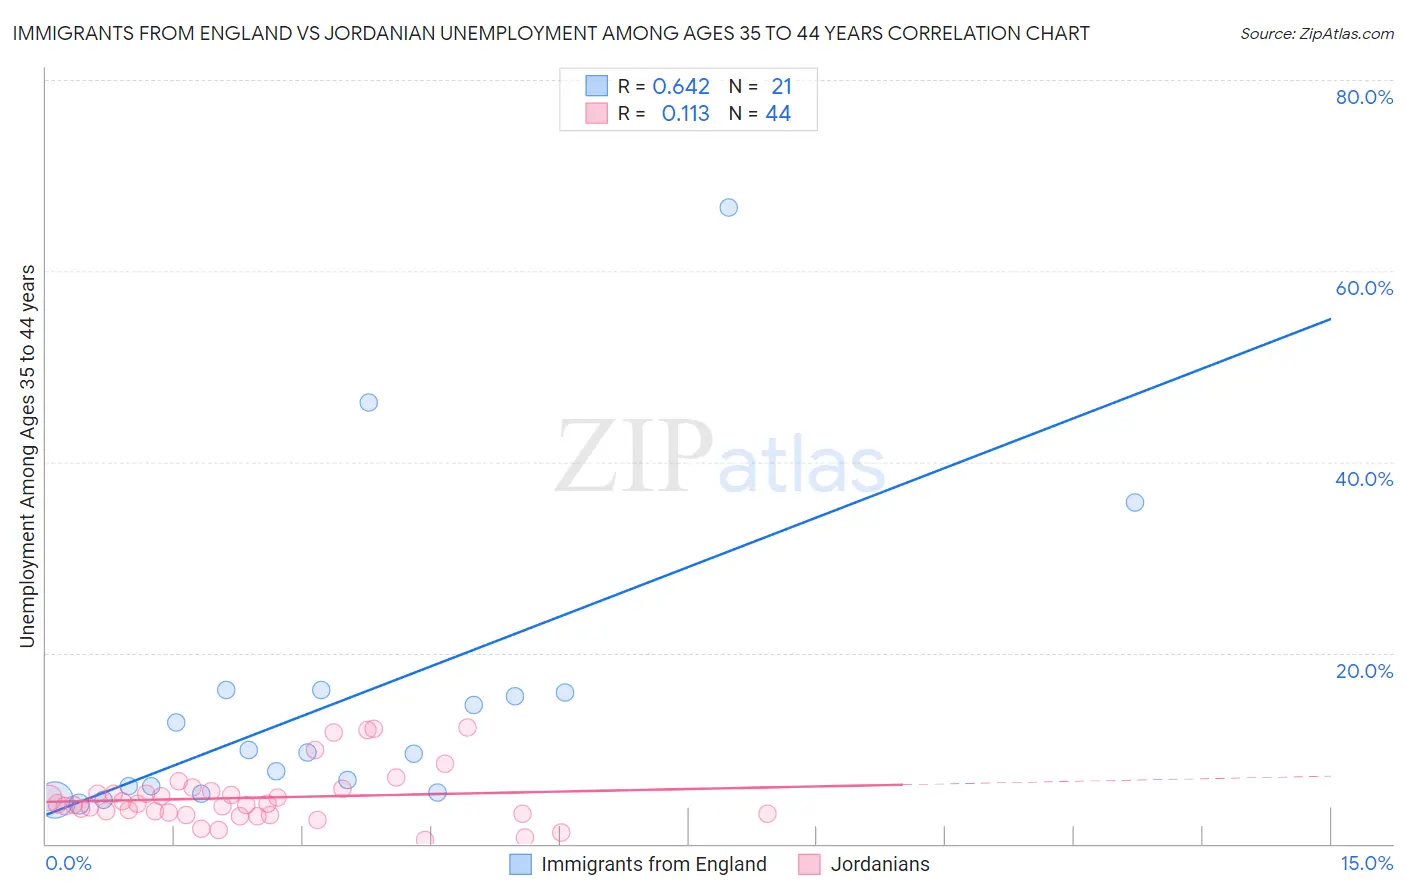
Immigrants from England vs Jordanian Unemployment Among Ages 35 to 44 years Correlation Chart

The statistical analysis conducted on geographies consisting of 382,025,174 people shows a significant positive correlation between the proportion of Immigrants from England and unemployment rate among population between the ages 35 and 44 in the United States with a correlation coefficient (R) of 0.642 and weighted average of 4.6%. Similarly, the statistical analysis conducted on geographies consisting of 165,487,232 people shows a poor positive correlation between the proportion of Jordanians and unemployment rate among population between the ages 35 and 44 in the United States with a correlation coefficient (R) of 0.113 and weighted average of 4.3%, a difference of 7.2%.
Immigrants from England vs Jordanian Unemployment Among Ages 35 to 44 years

Unemployment Among Ages 35 to 44 years Correlation Summary

MeasurementImmigrants from EnglandJordanian
Minimum4.1%0.40%
Maximum66.7%12.2%
Range62.6%11.8%
Mean15.1%4.8%
Median9.5%4.2%
Interquartile 25% (IQ1)5.7%3.1%
Interquartile 75% (IQ3)15.9%5.4%
Interquartile Range (IQR)10.3%2.3%
Standard Deviation (Sample)15.8%2.9%
Standard Deviation (Population)15.4%2.9%

Similar Demographics by Unemployment Among Ages 35 to 44 years

Demographics Similar to Immigrants from England by Unemployment Among Ages 35 to 44 years

In terms of unemployment among ages 35 to 44 years, the demographic groups most similar to Immigrants from England are Immigrants from Burma/Myanmar (4.6%, a difference of 0.15%), Slavic (4.6%, a difference of 0.17%), Immigrants from Vietnam (4.6%, a difference of 0.29%), Puget Sound Salish (4.6%, a difference of 0.29%), and Pakistani (4.6%, a difference of 0.29%).
DemographicsRating | RankUnemployment Among Ages 35 to 44 years
Immigrants | Switzerland
75.5
/100
|
#143
Good
4.6%
Immigrants | Russia
75.4
/100
|
#144
Good
4.6%
Immigrants | Eastern Europe
74.7
/100
|
#145
Good
4.6%
Immigrants | Denmark
74.4
/100
|
#146
Good
4.6%
Immigrants | Vietnam
73.8
/100
|
#147
Good
4.6%
Slavs
72.4
/100
|
#148
Good
4.6%
Immigrants | Burma/Myanmar
72.2
/100
|
#149
Good
4.6%
Immigrants | England
70.5
/100
|
#150
Good
4.6%
Puget Sound Salish
67.1
/100
|
#151
Good
4.6%
Pakistanis
67.1
/100
|
#152
Good
4.6%
Immigrants | Brazil
67.0
/100
|
#153
Good
4.6%
Immigrants | Western Europe
65.5
/100
|
#154
Good
4.6%
Whites/Caucasians
64.9
/100
|
#155
Good
4.6%
South Americans
63.7
/100
|
#156
Good
4.6%
Immigrants | Belarus
63.4
/100
|
#157
Good
4.6%

Demographics Similar to Jordanians by Unemployment Among Ages 35 to 44 years

In terms of unemployment among ages 35 to 44 years, the demographic groups most similar to Jordanians are Luxembourger (4.3%, a difference of 0.030%), Mongolian (4.3%, a difference of 0.13%), Immigrants from Sri Lanka (4.3%, a difference of 0.15%), Immigrants from Zimbabwe (4.3%, a difference of 0.18%), and Burmese (4.3%, a difference of 0.25%).
DemographicsRating | RankUnemployment Among Ages 35 to 44 years
Assyrians/Chaldeans/Syriacs
99.3
/100
|
#27
Exceptional
4.3%
Immigrants | Japan
99.3
/100
|
#28
Exceptional
4.3%
Europeans
99.2
/100
|
#29
Exceptional
4.3%
Immigrants | Pakistan
99.2
/100
|
#30
Exceptional
4.3%
Carpatho Rusyns
99.2
/100
|
#31
Exceptional
4.3%
Chinese
99.1
/100
|
#32
Exceptional
4.3%
Immigrants | Sri Lanka
99.1
/100
|
#33
Exceptional
4.3%
Jordanians
99.0
/100
|
#34
Exceptional
4.3%
Luxembourgers
99.0
/100
|
#35
Exceptional
4.3%
Mongolians
98.9
/100
|
#36
Exceptional
4.3%
Immigrants | Zimbabwe
98.9
/100
|
#37
Exceptional
4.3%
Burmese
98.9
/100
|
#38
Exceptional
4.3%
Palestinians
98.8
/100
|
#39
Exceptional
4.3%
Zimbabweans
98.8
/100
|
#40
Exceptional
4.3%
Belgians
98.7
/100
|
#41
Exceptional
4.3%