Immigrants from El Salvador vs Immigrants from Thailand Unemployment Among Ages 35 to 44 years
COMPARE
Immigrants from El Salvador
Immigrants from Thailand
Unemployment Among Ages 35 to 44 years
Unemployment Among Ages 35 to 44 years Comparison
Immigrants from El Salvador
Immigrants from Thailand
5.2%
UNEMPLOYMENT AMONG AGES 35 TO 44 YEARS
0.2/ 100
METRIC RATING
250th/ 347
METRIC RANK
4.8%
UNEMPLOYMENT AMONG AGES 35 TO 44 YEARS
22.9/ 100
METRIC RATING
198th/ 347
METRIC RANK
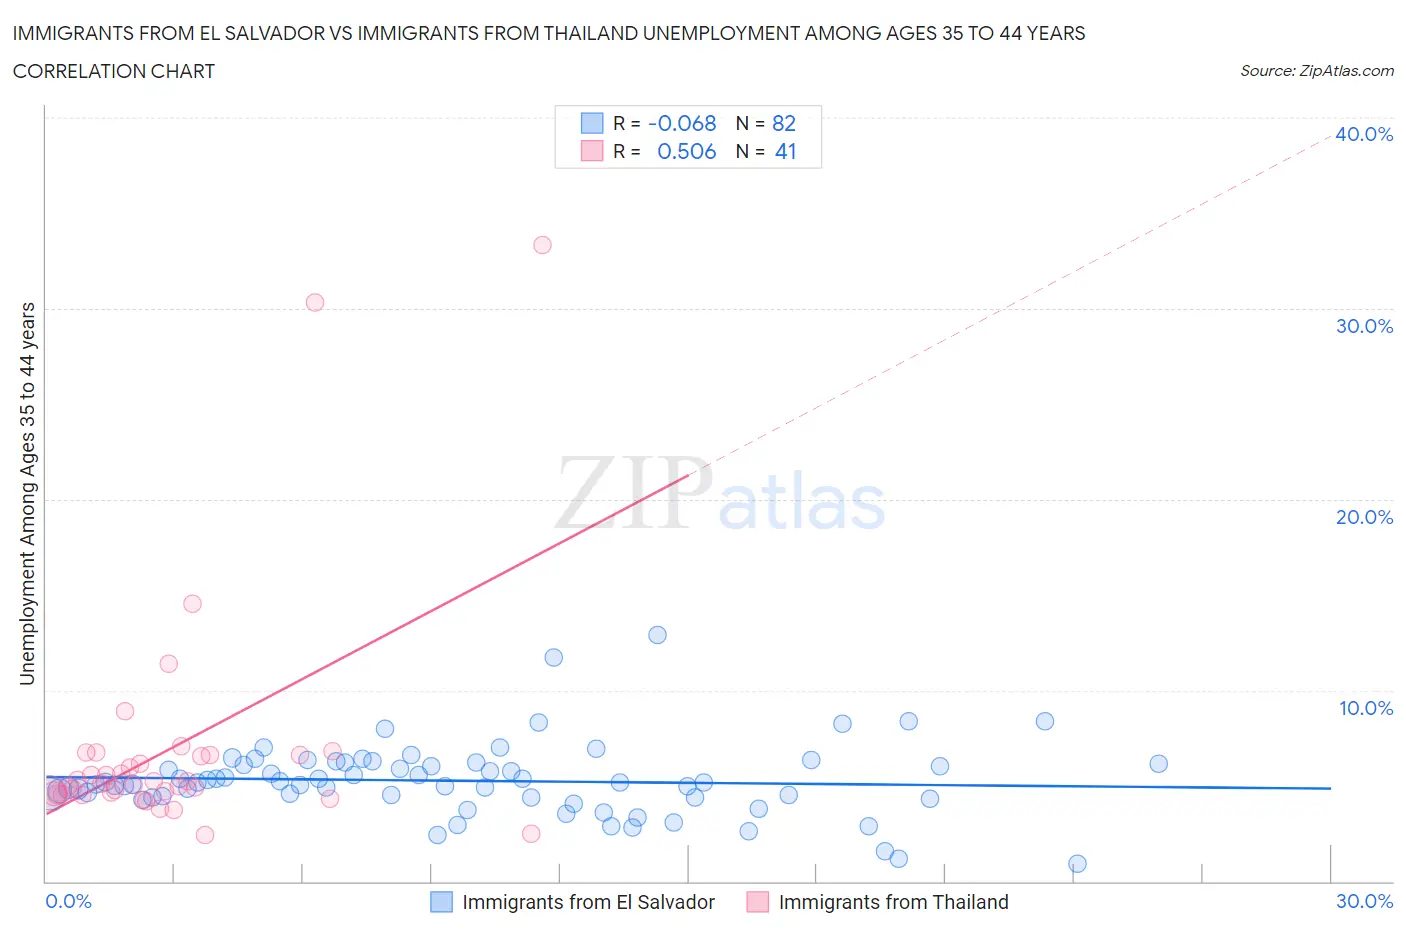
Immigrants from El Salvador vs Immigrants from Thailand Unemployment Among Ages 35 to 44 years Correlation Chart
The statistical analysis conducted on geographies consisting of 352,048,147 people shows a slight negative correlation between the proportion of Immigrants from El Salvador and unemployment rate among population between the ages 35 and 44 in the United States with a correlation coefficient (R) of -0.068 and weighted average of 5.2%. Similarly, the statistical analysis conducted on geographies consisting of 312,742,159 people shows a substantial positive correlation between the proportion of Immigrants from Thailand and unemployment rate among population between the ages 35 and 44 in the United States with a correlation coefficient (R) of 0.506 and weighted average of 4.8%, a difference of 8.4%.
Unemployment Among Ages 35 to 44 years Correlation Summary
| Measurement | Immigrants from El Salvador | Immigrants from Thailand |
| Minimum | 0.90% | 2.4% |
| Maximum | 12.9% | 33.3% |
| Range | 12.0% | 30.9% |
| Mean | 5.3% | 6.9% |
| Median | 5.2% | 5.1% |
| Interquartile 25% (IQ1) | 4.4% | 4.6% |
| Interquartile 75% (IQ3) | 6.1% | 6.6% |
| Interquartile Range (IQR) | 1.7% | 2.0% |
| Standard Deviation (Sample) | 1.9% | 6.1% |
| Standard Deviation (Population) | 1.9% | 6.0% |
Similar Demographics by Unemployment Among Ages 35 to 44 years
Demographics Similar to Immigrants from El Salvador by Unemployment Among Ages 35 to 44 years
In terms of unemployment among ages 35 to 44 years, the demographic groups most similar to Immigrants from El Salvador are Immigrants from Liberia (5.2%, a difference of 0.040%), Alsatian (5.2%, a difference of 0.060%), Comanche (5.2%, a difference of 0.44%), Immigrants from Somalia (5.2%, a difference of 0.56%), and Armenian (5.2%, a difference of 0.57%).
| Demographics | Rating | Rank | Unemployment Among Ages 35 to 44 years |
| Salvadorans | 0.4 /100 | #243 | Tragic 5.1% |
| Guatemalans | 0.4 /100 | #244 | Tragic 5.1% |
| Bahamians | 0.4 /100 | #245 | Tragic 5.2% |
| Immigrants | Guatemala | 0.4 /100 | #246 | Tragic 5.2% |
| Immigrants | Somalia | 0.3 /100 | #247 | Tragic 5.2% |
| Alsatians | 0.2 /100 | #248 | Tragic 5.2% |
| Immigrants | Liberia | 0.2 /100 | #249 | Tragic 5.2% |
| Immigrants | El Salvador | 0.2 /100 | #250 | Tragic 5.2% |
| Comanche | 0.2 /100 | #251 | Tragic 5.2% |
| Armenians | 0.2 /100 | #252 | Tragic 5.2% |
| Mexican American Indians | 0.2 /100 | #253 | Tragic 5.2% |
| Immigrants | Bahamas | 0.2 /100 | #254 | Tragic 5.2% |
| Cherokee | 0.2 /100 | #255 | Tragic 5.2% |
| Seminole | 0.1 /100 | #256 | Tragic 5.2% |
| Immigrants | Fiji | 0.1 /100 | #257 | Tragic 5.3% |
Demographics Similar to Immigrants from Thailand by Unemployment Among Ages 35 to 44 years
In terms of unemployment among ages 35 to 44 years, the demographic groups most similar to Immigrants from Thailand are Immigrants from Oceania (4.8%, a difference of 0.030%), Immigrants from Syria (4.8%, a difference of 0.070%), Immigrants from Middle Africa (4.8%, a difference of 0.10%), Immigrants from Ukraine (4.8%, a difference of 0.15%), and Ugandan (4.8%, a difference of 0.15%).
| Demographics | Rating | Rank | Unemployment Among Ages 35 to 44 years |
| Immigrants | South America | 33.8 /100 | #191 | Fair 4.7% |
| Immigrants | Albania | 30.5 /100 | #192 | Fair 4.8% |
| Spanish | 30.4 /100 | #193 | Fair 4.8% |
| Koreans | 28.1 /100 | #194 | Fair 4.8% |
| Bangladeshis | 28.0 /100 | #195 | Fair 4.8% |
| Immigrants | Syria | 23.6 /100 | #196 | Fair 4.8% |
| Immigrants | Oceania | 23.2 /100 | #197 | Fair 4.8% |
| Immigrants | Thailand | 22.9 /100 | #198 | Fair 4.8% |
| Immigrants | Middle Africa | 21.9 /100 | #199 | Fair 4.8% |
| Immigrants | Ukraine | 21.4 /100 | #200 | Fair 4.8% |
| Ugandans | 21.4 /100 | #201 | Fair 4.8% |
| Immigrants | Afghanistan | 20.2 /100 | #202 | Fair 4.8% |
| Uruguayans | 20.0 /100 | #203 | Fair 4.8% |
| Immigrants | Philippines | 19.8 /100 | #204 | Poor 4.8% |
| Spaniards | 18.7 /100 | #205 | Poor 4.8% |