Immigrants from El Salvador vs Immigrants from Ireland Male Unemployment
COMPARE
Immigrants from El Salvador
Immigrants from Ireland
Male Unemployment
Male Unemployment Comparison
Immigrants from El Salvador
Immigrants from Ireland
5.7%
MALE UNEMPLOYMENT
0.7/ 100
METRIC RATING
244th/ 347
METRIC RANK
5.3%
MALE UNEMPLOYMENT
57.7/ 100
METRIC RATING
168th/ 347
METRIC RANK
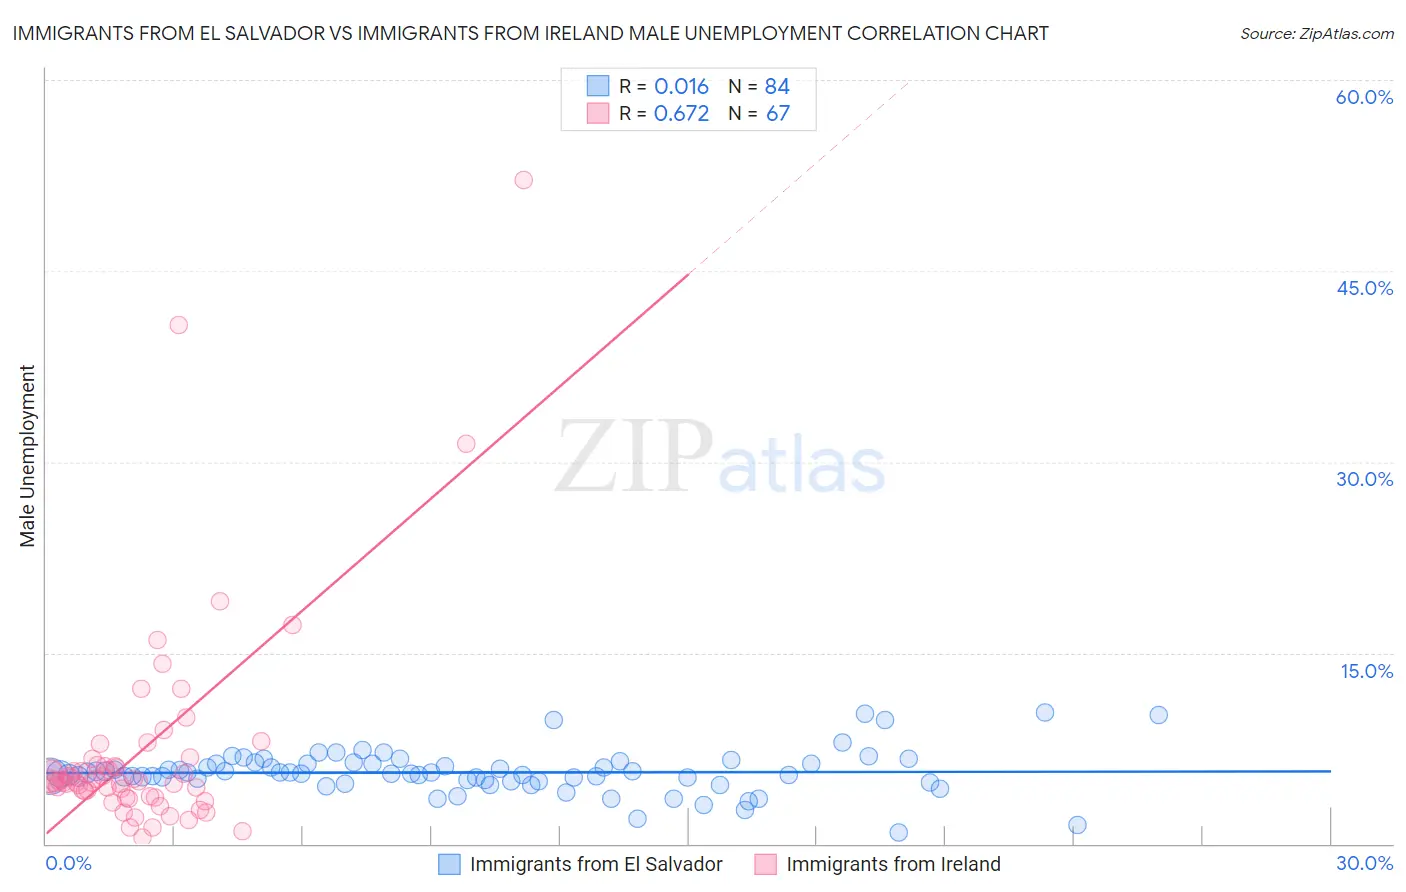
Immigrants from El Salvador vs Immigrants from Ireland Male Unemployment Correlation Chart
The statistical analysis conducted on geographies consisting of 356,740,300 people shows no correlation between the proportion of Immigrants from El Salvador and unemployment rate among males in the United States with a correlation coefficient (R) of 0.016 and weighted average of 5.7%. Similarly, the statistical analysis conducted on geographies consisting of 240,228,125 people shows a significant positive correlation between the proportion of Immigrants from Ireland and unemployment rate among males in the United States with a correlation coefficient (R) of 0.672 and weighted average of 5.3%, a difference of 7.6%.
Male Unemployment Correlation Summary
| Measurement | Immigrants from El Salvador | Immigrants from Ireland |
| Minimum | 0.90% | 0.50% |
| Maximum | 10.3% | 52.1% |
| Range | 9.4% | 51.6% |
| Mean | 5.6% | 7.2% |
| Median | 5.5% | 4.9% |
| Interquartile 25% (IQ1) | 5.0% | 3.7% |
| Interquartile 75% (IQ3) | 6.3% | 6.2% |
| Interquartile Range (IQR) | 1.3% | 2.5% |
| Standard Deviation (Sample) | 1.7% | 8.5% |
| Standard Deviation (Population) | 1.7% | 8.4% |
Similar Demographics by Male Unemployment
Demographics Similar to Immigrants from El Salvador by Male Unemployment
In terms of male unemployment, the demographic groups most similar to Immigrants from El Salvador are Bangladeshi (5.7%, a difference of 0.050%), Yaqui (5.7%, a difference of 0.17%), Iroquois (5.7%, a difference of 0.26%), Ottawa (5.7%, a difference of 0.33%), and Hawaiian (5.7%, a difference of 0.35%).
| Demographics | Rating | Rank | Male Unemployment |
| Hondurans | 1.1 /100 | #237 | Tragic 5.6% |
| Native Hawaiians | 1.1 /100 | #238 | Tragic 5.6% |
| Immigrants | Guatemala | 1.1 /100 | #239 | Tragic 5.6% |
| Immigrants | Cameroon | 1.0 /100 | #240 | Tragic 5.6% |
| Salvadorans | 1.0 /100 | #241 | Tragic 5.7% |
| Ottawa | 0.9 /100 | #242 | Tragic 5.7% |
| Bangladeshis | 0.8 /100 | #243 | Tragic 5.7% |
| Immigrants | El Salvador | 0.7 /100 | #244 | Tragic 5.7% |
| Yaqui | 0.7 /100 | #245 | Tragic 5.7% |
| Iroquois | 0.6 /100 | #246 | Tragic 5.7% |
| Hawaiians | 0.6 /100 | #247 | Tragic 5.7% |
| Marshallese | 0.5 /100 | #248 | Tragic 5.7% |
| Cree | 0.4 /100 | #249 | Tragic 5.7% |
| Immigrants | Bahamas | 0.4 /100 | #250 | Tragic 5.7% |
| Spanish Americans | 0.3 /100 | #251 | Tragic 5.7% |
Demographics Similar to Immigrants from Ireland by Male Unemployment
In terms of male unemployment, the demographic groups most similar to Immigrants from Ireland are Immigrants from Vietnam (5.3%, a difference of 0.020%), Immigrants from Congo (5.3%, a difference of 0.020%), Immigrants from Morocco (5.3%, a difference of 0.15%), South American (5.3%, a difference of 0.18%), and Immigrants from Eastern Europe (5.3%, a difference of 0.22%).
| Demographics | Rating | Rank | Male Unemployment |
| Immigrants | China | 70.6 /100 | #161 | Good 5.2% |
| Immigrants | Egypt | 65.9 /100 | #162 | Good 5.2% |
| Immigrants | Hong Kong | 65.7 /100 | #163 | Good 5.2% |
| Afghans | 62.0 /100 | #164 | Good 5.3% |
| South Americans | 60.6 /100 | #165 | Good 5.3% |
| Immigrants | Morocco | 60.2 /100 | #166 | Good 5.3% |
| Immigrants | Vietnam | 58.1 /100 | #167 | Average 5.3% |
| Immigrants | Ireland | 57.7 /100 | #168 | Average 5.3% |
| Immigrants | Congo | 57.4 /100 | #169 | Average 5.3% |
| Immigrants | Eastern Europe | 54.1 /100 | #170 | Average 5.3% |
| Peruvians | 51.9 /100 | #171 | Average 5.3% |
| Immigrants | Kazakhstan | 50.8 /100 | #172 | Average 5.3% |
| Immigrants | Russia | 50.7 /100 | #173 | Average 5.3% |
| Immigrants | Iran | 50.0 /100 | #174 | Average 5.3% |
| Immigrants | Iraq | 48.1 /100 | #175 | Average 5.3% |