Immigrants from Ecuador vs European Unemployment Among Ages 65 to 74 years
COMPARE
Immigrants from Ecuador
European
Unemployment Among Ages 65 to 74 years
Unemployment Among Ages 65 to 74 years Comparison
Immigrants from Ecuador
Europeans
5.8%
UNEMPLOYMENT AMONG AGES 65 TO 74 YEARS
0.0/ 100
METRIC RATING
309th/ 347
METRIC RANK
5.1%
UNEMPLOYMENT AMONG AGES 65 TO 74 YEARS
99.6/ 100
METRIC RATING
52nd/ 347
METRIC RANK
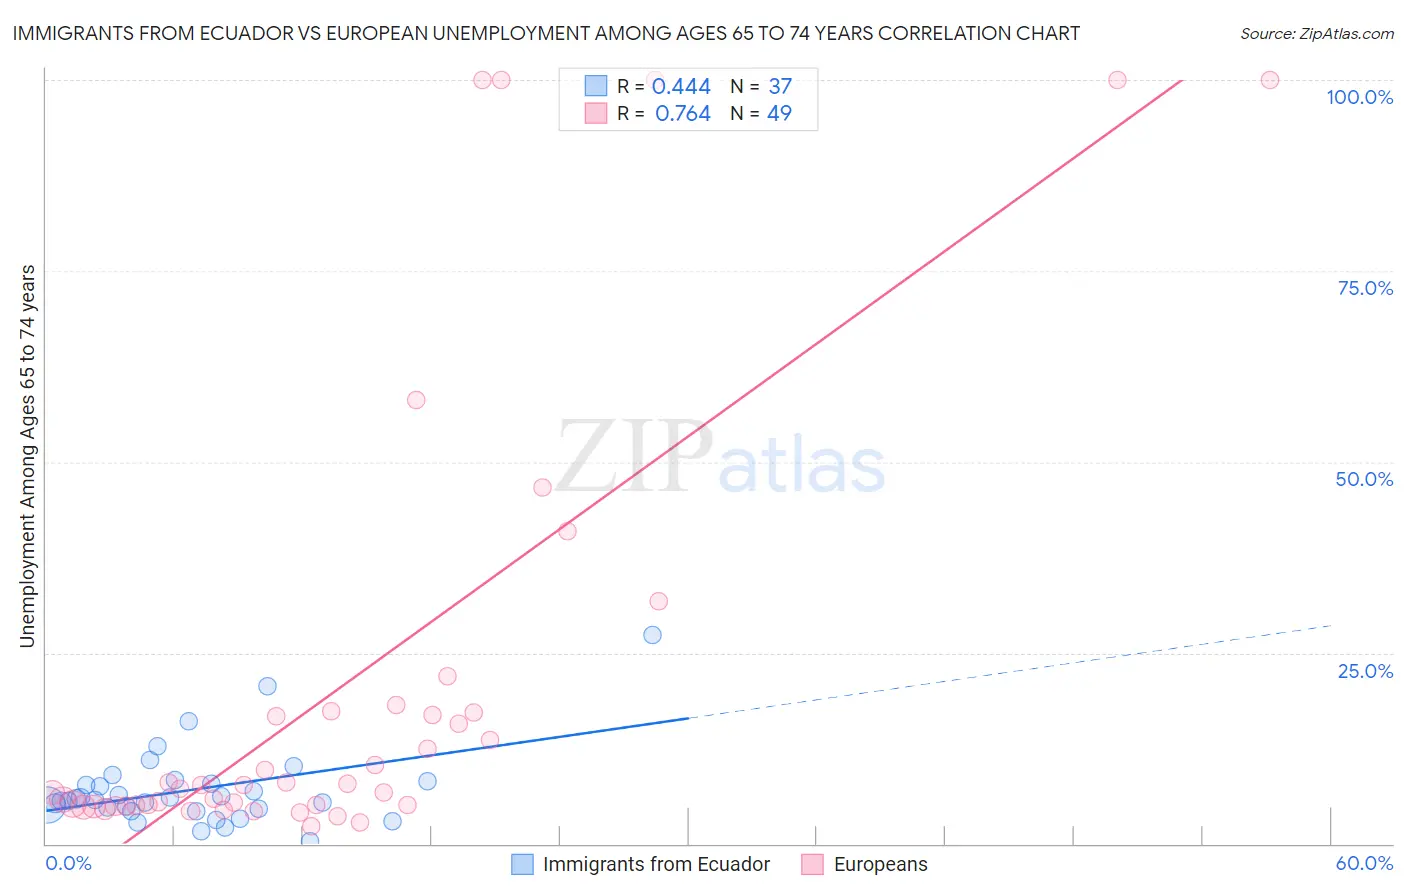
Immigrants from Ecuador vs European Unemployment Among Ages 65 to 74 years Correlation Chart
The statistical analysis conducted on geographies consisting of 250,466,879 people shows a moderate positive correlation between the proportion of Immigrants from Ecuador and unemployment rate among population between the ages 65 and 74 in the United States with a correlation coefficient (R) of 0.444 and weighted average of 5.8%. Similarly, the statistical analysis conducted on geographies consisting of 441,956,134 people shows a strong positive correlation between the proportion of Europeans and unemployment rate among population between the ages 65 and 74 in the United States with a correlation coefficient (R) of 0.764 and weighted average of 5.1%, a difference of 14.1%.
Unemployment Among Ages 65 to 74 years Correlation Summary
| Measurement | Immigrants from Ecuador | European |
| Minimum | 0.40% | 2.3% |
| Maximum | 27.4% | 100.0% |
| Range | 27.0% | 97.7% |
| Mean | 7.1% | 20.5% |
| Median | 5.7% | 7.7% |
| Interquartile 25% (IQ1) | 4.4% | 5.0% |
| Interquartile 75% (IQ3) | 8.0% | 17.2% |
| Interquartile Range (IQR) | 3.7% | 12.2% |
| Standard Deviation (Sample) | 5.2% | 29.3% |
| Standard Deviation (Population) | 5.1% | 29.0% |
Similar Demographics by Unemployment Among Ages 65 to 74 years
Demographics Similar to Immigrants from Ecuador by Unemployment Among Ages 65 to 74 years
In terms of unemployment among ages 65 to 74 years, the demographic groups most similar to Immigrants from Ecuador are Guatemalan (5.8%, a difference of 0.040%), Mexican (5.8%, a difference of 0.13%), Cheyenne (5.8%, a difference of 0.13%), British West Indian (5.8%, a difference of 0.13%), and Immigrants from Bangladesh (5.9%, a difference of 0.14%).
| Demographics | Rating | Rank | Unemployment Among Ages 65 to 74 years |
| Liberians | 0.0 /100 | #302 | Tragic 5.8% |
| Arapaho | 0.0 /100 | #303 | Tragic 5.8% |
| Salvadorans | 0.0 /100 | #304 | Tragic 5.8% |
| Mexicans | 0.0 /100 | #305 | Tragic 5.8% |
| Cheyenne | 0.0 /100 | #306 | Tragic 5.8% |
| British West Indians | 0.0 /100 | #307 | Tragic 5.8% |
| Guatemalans | 0.0 /100 | #308 | Tragic 5.8% |
| Immigrants | Ecuador | 0.0 /100 | #309 | Tragic 5.8% |
| Immigrants | Bangladesh | 0.0 /100 | #310 | Tragic 5.9% |
| Venezuelans | 0.0 /100 | #311 | Tragic 5.9% |
| Hispanics or Latinos | 0.0 /100 | #312 | Tragic 5.9% |
| Vietnamese | 0.0 /100 | #313 | Tragic 5.9% |
| Immigrants | Venezuela | 0.0 /100 | #314 | Tragic 5.9% |
| Immigrants | Guatemala | 0.0 /100 | #315 | Tragic 5.9% |
| Immigrants | El Salvador | 0.0 /100 | #316 | Tragic 5.9% |
Demographics Similar to Europeans by Unemployment Among Ages 65 to 74 years
In terms of unemployment among ages 65 to 74 years, the demographic groups most similar to Europeans are Immigrants from Ethiopia (5.1%, a difference of 0.010%), Immigrants from Nicaragua (5.1%, a difference of 0.030%), Carpatho Rusyn (5.1%, a difference of 0.12%), Swedish (5.1%, a difference of 0.20%), and Croatian (5.1%, a difference of 0.20%).
| Demographics | Rating | Rank | Unemployment Among Ages 65 to 74 years |
| Sioux | 99.8 /100 | #45 | Exceptional 5.1% |
| Immigrants | Kenya | 99.8 /100 | #46 | Exceptional 5.1% |
| Immigrants | Uganda | 99.8 /100 | #47 | Exceptional 5.1% |
| Choctaw | 99.8 /100 | #48 | Exceptional 5.1% |
| Immigrants | Austria | 99.8 /100 | #49 | Exceptional 5.1% |
| Immigrants | Zimbabwe | 99.7 /100 | #50 | Exceptional 5.1% |
| Immigrants | Kazakhstan | 99.7 /100 | #51 | Exceptional 5.1% |
| Europeans | 99.6 /100 | #52 | Exceptional 5.1% |
| Immigrants | Ethiopia | 99.6 /100 | #53 | Exceptional 5.1% |
| Immigrants | Nicaragua | 99.6 /100 | #54 | Exceptional 5.1% |
| Carpatho Rusyns | 99.6 /100 | #55 | Exceptional 5.1% |
| Swedes | 99.5 /100 | #56 | Exceptional 5.1% |
| Croatians | 99.5 /100 | #57 | Exceptional 5.1% |
| Germans | 99.5 /100 | #58 | Exceptional 5.1% |
| Immigrants | Bulgaria | 99.4 /100 | #59 | Exceptional 5.1% |