Immigrants from Ecuador vs African Unemployment Among Ages 25 to 29 years
COMPARE
Immigrants from Ecuador
African
Unemployment Among Ages 25 to 29 years
Unemployment Among Ages 25 to 29 years Comparison
Immigrants from Ecuador
Africans
7.4%
UNEMPLOYMENT AMONG AGES 25 TO 29 YEARS
0.1/ 100
METRIC RATING
268th/ 347
METRIC RANK
7.6%
UNEMPLOYMENT AMONG AGES 25 TO 29 YEARS
0.0/ 100
METRIC RATING
288th/ 347
METRIC RANK
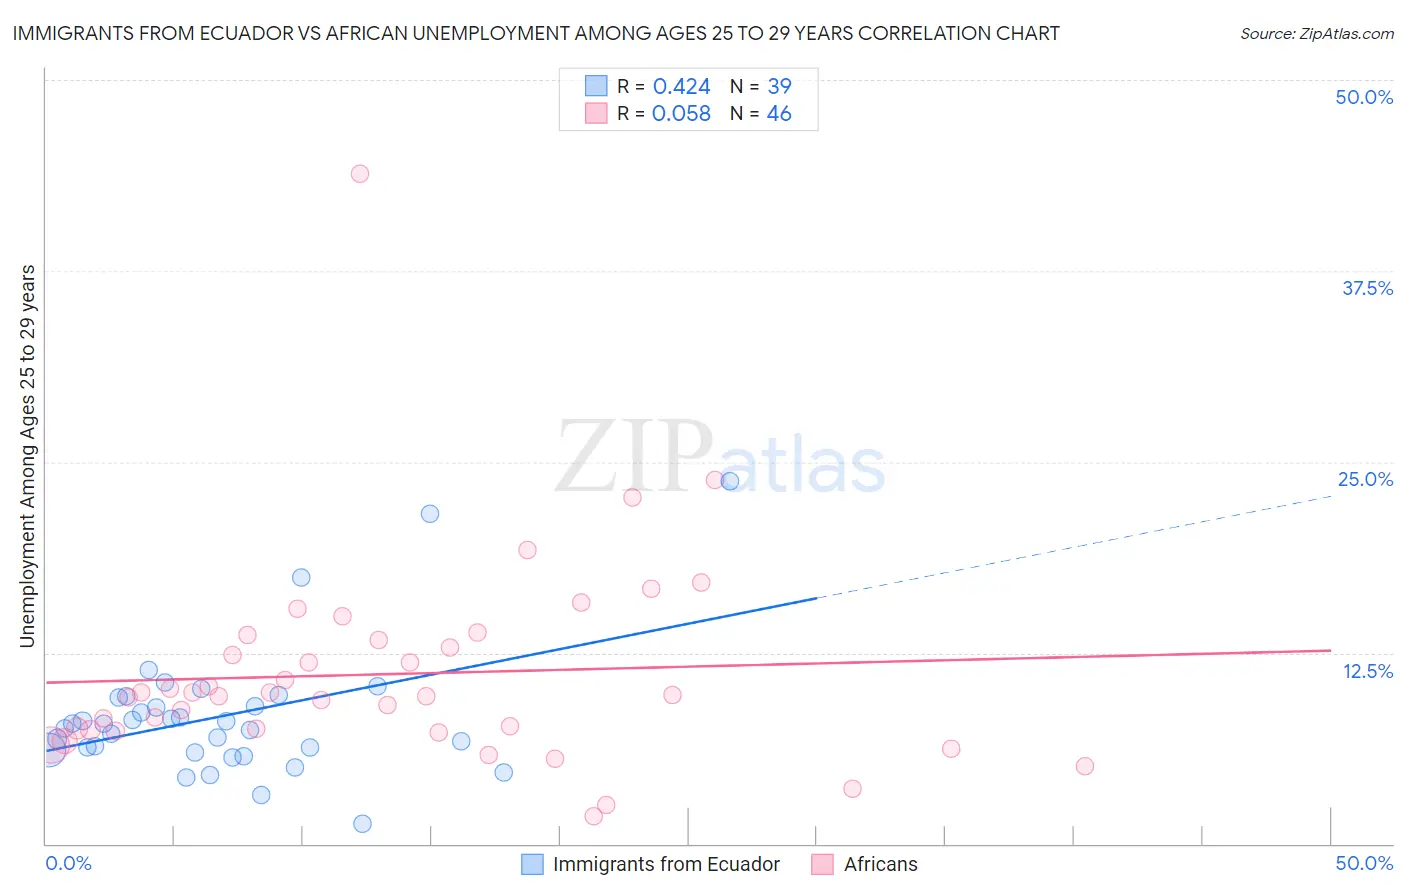
Immigrants from Ecuador vs African Unemployment Among Ages 25 to 29 years Correlation Chart
The statistical analysis conducted on geographies consisting of 263,330,571 people shows a moderate positive correlation between the proportion of Immigrants from Ecuador and unemployment rate among population between the ages 25 and 29 in the United States with a correlation coefficient (R) of 0.424 and weighted average of 7.4%. Similarly, the statistical analysis conducted on geographies consisting of 443,131,541 people shows a slight positive correlation between the proportion of Africans and unemployment rate among population between the ages 25 and 29 in the United States with a correlation coefficient (R) of 0.058 and weighted average of 7.6%, a difference of 3.0%.
Unemployment Among Ages 25 to 29 years Correlation Summary
| Measurement | Immigrants from Ecuador | African |
| Minimum | 1.3% | 1.8% |
| Maximum | 23.7% | 43.9% |
| Range | 22.4% | 42.1% |
| Mean | 8.3% | 11.1% |
| Median | 7.9% | 9.7% |
| Interquartile 25% (IQ1) | 6.2% | 7.5% |
| Interquartile 75% (IQ3) | 9.6% | 13.3% |
| Interquartile Range (IQR) | 3.4% | 5.8% |
| Standard Deviation (Sample) | 4.3% | 6.8% |
| Standard Deviation (Population) | 4.2% | 6.7% |
Demographics Similar to Immigrants from Ecuador and Africans by Unemployment Among Ages 25 to 29 years
In terms of unemployment among ages 25 to 29 years, the demographic groups most similar to Immigrants from Ecuador are Immigrants from Latin America (7.4%, a difference of 0.060%), Bahamian (7.5%, a difference of 0.57%), Choctaw (7.5%, a difference of 0.59%), Immigrants from Bahamas (7.5%, a difference of 0.65%), and Immigrants from Nigeria (7.5%, a difference of 0.67%). Similarly, the demographic groups most similar to Africans are Immigrants from Mexico (7.6%, a difference of 0.060%), Vietnamese (7.6%, a difference of 0.65%), Senegalese (7.6%, a difference of 0.74%), Cherokee (7.6%, a difference of 0.86%), and Creek (7.6%, a difference of 0.87%).
| Demographics | Rating | Rank | Unemployment Among Ages 25 to 29 years |
| Immigrants | Ecuador | 0.1 /100 | #268 | Tragic 7.4% |
| Immigrants | Latin America | 0.1 /100 | #269 | Tragic 7.4% |
| Bahamians | 0.0 /100 | #270 | Tragic 7.5% |
| Choctaw | 0.0 /100 | #271 | Tragic 7.5% |
| Immigrants | Bahamas | 0.0 /100 | #272 | Tragic 7.5% |
| Immigrants | Nigeria | 0.0 /100 | #273 | Tragic 7.5% |
| Immigrants | Central America | 0.0 /100 | #274 | Tragic 7.5% |
| Immigrants | Ghana | 0.0 /100 | #275 | Tragic 7.5% |
| French American Indians | 0.0 /100 | #276 | Tragic 7.5% |
| Iroquois | 0.0 /100 | #277 | Tragic 7.5% |
| Mexicans | 0.0 /100 | #278 | Tragic 7.5% |
| Nepalese | 0.0 /100 | #279 | Tragic 7.5% |
| Immigrants | Caribbean | 0.0 /100 | #280 | Tragic 7.5% |
| Immigrants | Bangladesh | 0.0 /100 | #281 | Tragic 7.5% |
| Immigrants | Senegal | 0.0 /100 | #282 | Tragic 7.6% |
| Creek | 0.0 /100 | #283 | Tragic 7.6% |
| Cherokee | 0.0 /100 | #284 | Tragic 7.6% |
| Senegalese | 0.0 /100 | #285 | Tragic 7.6% |
| Vietnamese | 0.0 /100 | #286 | Tragic 7.6% |
| Immigrants | Mexico | 0.0 /100 | #287 | Tragic 7.6% |
| Africans | 0.0 /100 | #288 | Tragic 7.6% |