Immigrants from Eastern Asia vs Tlingit-Haida Unemployment Among Ages 55 to 59 years
COMPARE
Immigrants from Eastern Asia
Tlingit-Haida
Unemployment Among Ages 55 to 59 years
Unemployment Among Ages 55 to 59 years Comparison
Immigrants from Eastern Asia
Tlingit-Haida
4.8%
UNEMPLOYMENT AMONG AGES 55 TO 59 YEARS
36.1/ 100
METRIC RATING
188th/ 347
METRIC RANK
5.7%
UNEMPLOYMENT AMONG AGES 55 TO 59 YEARS
0.0/ 100
METRIC RATING
314th/ 347
METRIC RANK
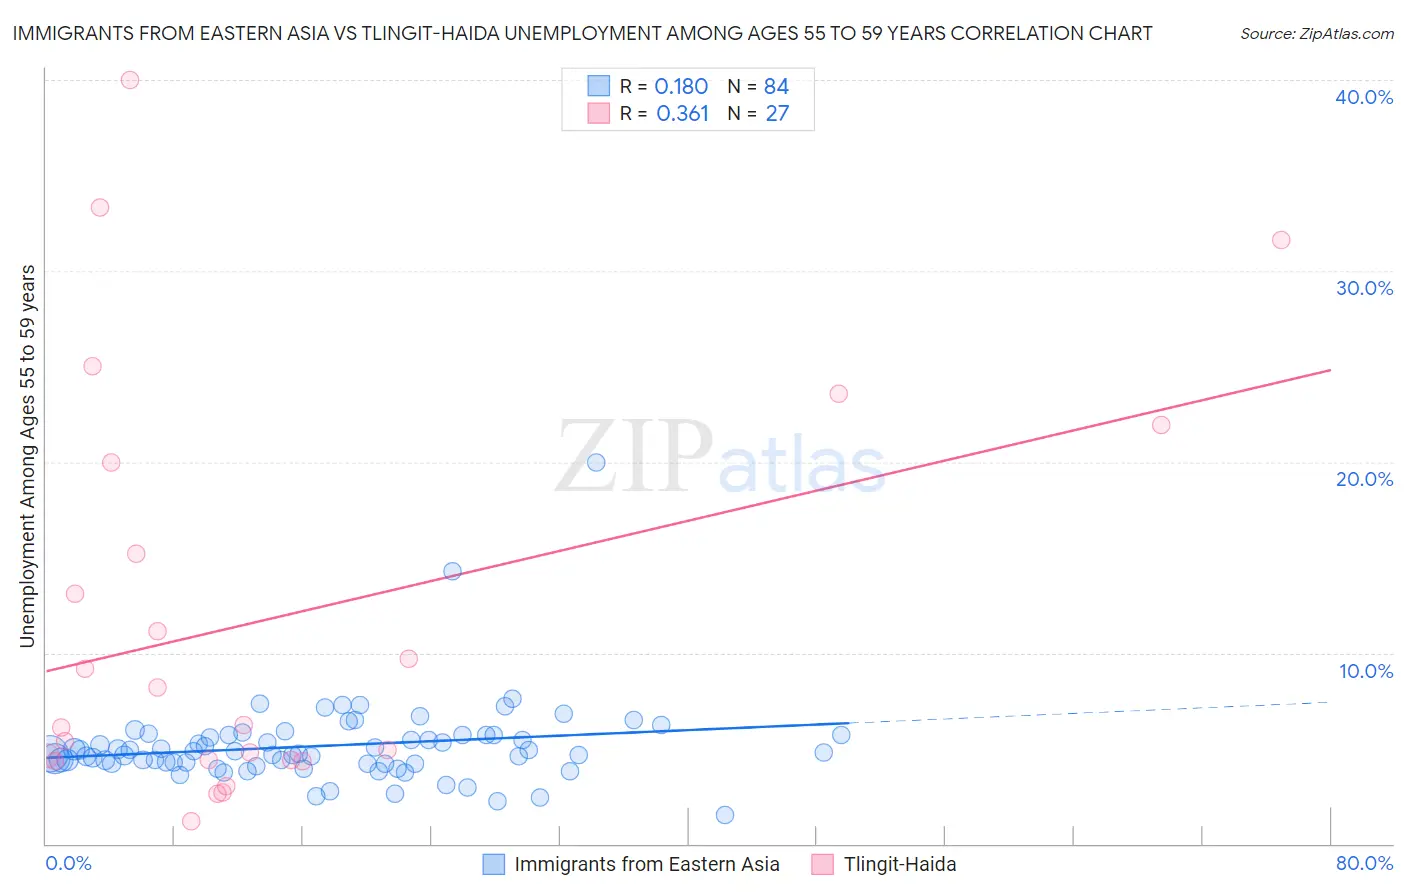
Immigrants from Eastern Asia vs Tlingit-Haida Unemployment Among Ages 55 to 59 years Correlation Chart
The statistical analysis conducted on geographies consisting of 449,925,486 people shows a poor positive correlation between the proportion of Immigrants from Eastern Asia and unemployment rate among population between the ages 55 and 59 in the United States with a correlation coefficient (R) of 0.180 and weighted average of 4.8%. Similarly, the statistical analysis conducted on geographies consisting of 58,839,053 people shows a mild positive correlation between the proportion of Tlingit-Haida and unemployment rate among population between the ages 55 and 59 in the United States with a correlation coefficient (R) of 0.361 and weighted average of 5.7%, a difference of 16.8%.
Unemployment Among Ages 55 to 59 years Correlation Summary
| Measurement | Immigrants from Eastern Asia | Tlingit-Haida |
| Minimum | 1.5% | 1.2% |
| Maximum | 20.0% | 40.0% |
| Range | 18.5% | 38.8% |
| Mean | 5.1% | 11.9% |
| Median | 4.8% | 6.2% |
| Interquartile 25% (IQ1) | 4.2% | 4.4% |
| Interquartile 75% (IQ3) | 5.7% | 20.0% |
| Interquartile Range (IQR) | 1.5% | 15.6% |
| Standard Deviation (Sample) | 2.3% | 10.7% |
| Standard Deviation (Population) | 2.3% | 10.5% |
Similar Demographics by Unemployment Among Ages 55 to 59 years
Demographics Similar to Immigrants from Eastern Asia by Unemployment Among Ages 55 to 59 years
In terms of unemployment among ages 55 to 59 years, the demographic groups most similar to Immigrants from Eastern Asia are Immigrants from Morocco (4.8%, a difference of 0.020%), Peruvian (4.8%, a difference of 0.040%), Osage (4.8%, a difference of 0.040%), Iroquois (4.9%, a difference of 0.070%), and Immigrants from Czechoslovakia (4.8%, a difference of 0.090%).
| Demographics | Rating | Rank | Unemployment Among Ages 55 to 59 years |
| Immigrants | Hungary | 40.4 /100 | #181 | Average 4.8% |
| Immigrants | Europe | 40.4 /100 | #182 | Average 4.8% |
| Immigrants | Peru | 38.6 /100 | #183 | Fair 4.8% |
| Immigrants | Czechoslovakia | 38.0 /100 | #184 | Fair 4.8% |
| Peruvians | 37.0 /100 | #185 | Fair 4.8% |
| Osage | 37.0 /100 | #186 | Fair 4.8% |
| Immigrants | Morocco | 36.5 /100 | #187 | Fair 4.8% |
| Immigrants | Eastern Asia | 36.1 /100 | #188 | Fair 4.8% |
| Iroquois | 34.5 /100 | #189 | Fair 4.9% |
| Russians | 33.9 /100 | #190 | Fair 4.9% |
| Iranians | 32.4 /100 | #191 | Fair 4.9% |
| Immigrants | Ukraine | 31.7 /100 | #192 | Fair 4.9% |
| Immigrants | Italy | 30.1 /100 | #193 | Fair 4.9% |
| Spaniards | 27.2 /100 | #194 | Fair 4.9% |
| Estonians | 27.2 /100 | #195 | Fair 4.9% |
Demographics Similar to Tlingit-Haida by Unemployment Among Ages 55 to 59 years
In terms of unemployment among ages 55 to 59 years, the demographic groups most similar to Tlingit-Haida are Guyanese (5.7%, a difference of 0.15%), Central American Indian (5.6%, a difference of 0.29%), Immigrants from Ecuador (5.7%, a difference of 0.34%), Ecuadorian (5.6%, a difference of 0.48%), and Hmong (5.7%, a difference of 0.57%).
| Demographics | Rating | Rank | Unemployment Among Ages 55 to 59 years |
| Immigrants | Belize | 0.0 /100 | #307 | Tragic 5.5% |
| Spanish American Indians | 0.0 /100 | #308 | Tragic 5.6% |
| Nepalese | 0.0 /100 | #309 | Tragic 5.6% |
| Belizeans | 0.0 /100 | #310 | Tragic 5.6% |
| Houma | 0.0 /100 | #311 | Tragic 5.6% |
| Ecuadorians | 0.0 /100 | #312 | Tragic 5.6% |
| Central American Indians | 0.0 /100 | #313 | Tragic 5.6% |
| Tlingit-Haida | 0.0 /100 | #314 | Tragic 5.7% |
| Guyanese | 0.0 /100 | #315 | Tragic 5.7% |
| Immigrants | Ecuador | 0.0 /100 | #316 | Tragic 5.7% |
| Hmong | 0.0 /100 | #317 | Tragic 5.7% |
| Immigrants | Guyana | 0.0 /100 | #318 | Tragic 5.8% |
| Kiowa | 0.0 /100 | #319 | Tragic 5.8% |
| Immigrants | Azores | 0.0 /100 | #320 | Tragic 5.8% |
| Chippewa | 0.0 /100 | #321 | Tragic 5.9% |