Immigrants from Eastern Asia vs Immigrants from Peru Unemployment Among Women with Children Under 6 years
COMPARE
Immigrants from Eastern Asia
Immigrants from Peru
Unemployment Among Women with Children Under 6 years
Unemployment Among Women with Children Under 6 years Comparison
Immigrants from Eastern Asia
Immigrants from Peru
6.3%
UNEMPLOYMENT AMONG WOMEN WITH CHILDREN UNDER 6 YEARS
100.0/ 100
METRIC RATING
13th/ 347
METRIC RANK
7.5%
UNEMPLOYMENT AMONG WOMEN WITH CHILDREN UNDER 6 YEARS
74.9/ 100
METRIC RATING
151st/ 347
METRIC RANK
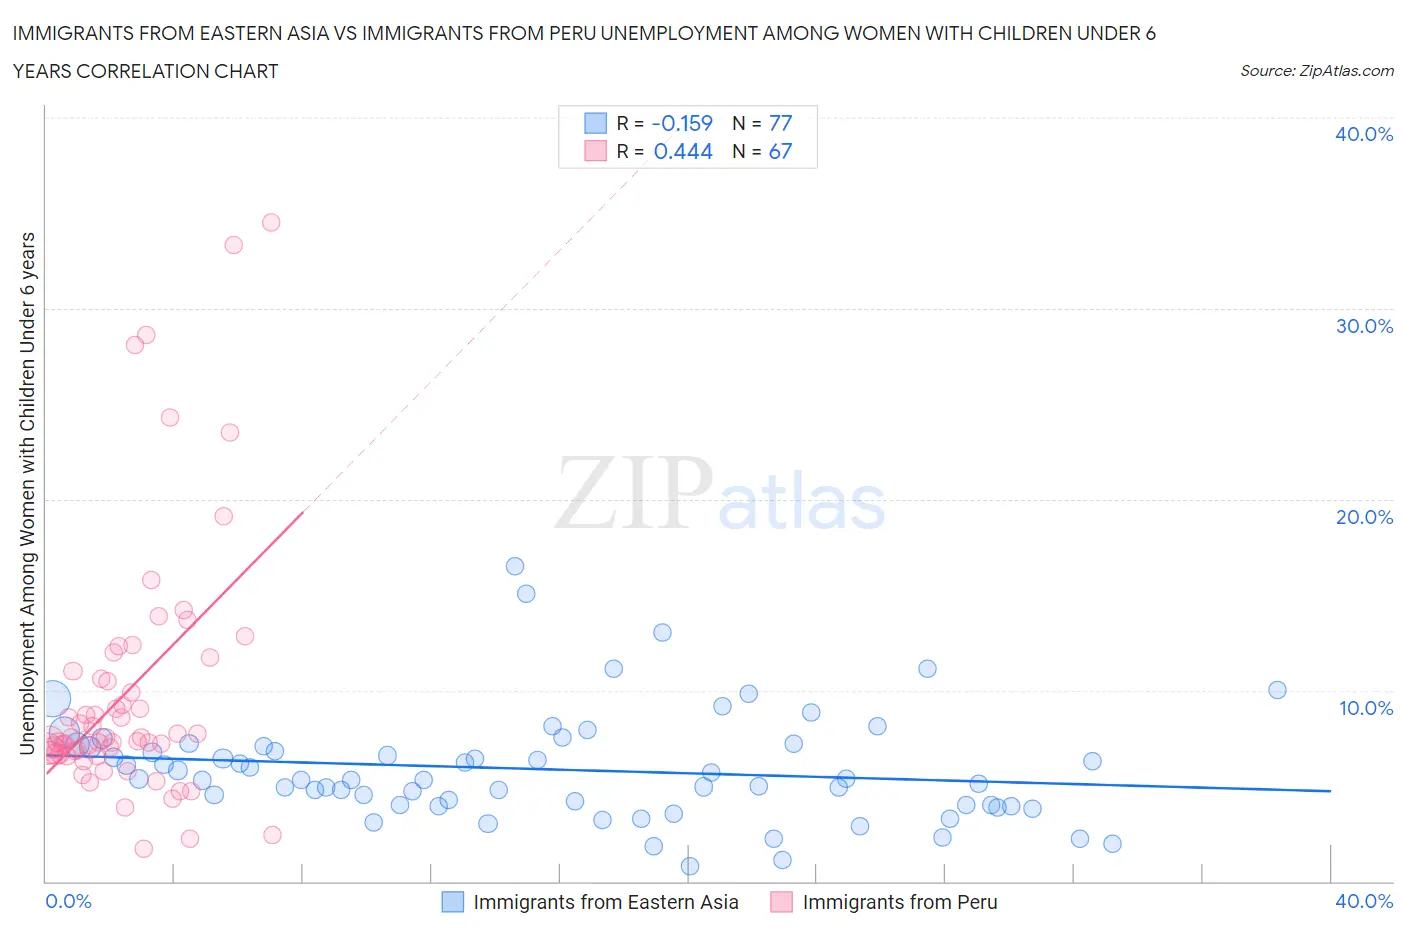
Immigrants from Eastern Asia vs Immigrants from Peru Unemployment Among Women with Children Under 6 years Correlation Chart
The statistical analysis conducted on geographies consisting of 354,997,962 people shows a poor negative correlation between the proportion of Immigrants from Eastern Asia and unemployment rate among women with children under the age of 6 in the United States with a correlation coefficient (R) of -0.159 and weighted average of 6.3%. Similarly, the statistical analysis conducted on geographies consisting of 264,130,513 people shows a moderate positive correlation between the proportion of Immigrants from Peru and unemployment rate among women with children under the age of 6 in the United States with a correlation coefficient (R) of 0.444 and weighted average of 7.5%, a difference of 19.1%.
Unemployment Among Women with Children Under 6 years Correlation Summary
| Measurement | Immigrants from Eastern Asia | Immigrants from Peru |
| Minimum | 0.80% | 1.7% |
| Maximum | 16.5% | 34.5% |
| Range | 15.7% | 32.8% |
| Mean | 5.9% | 9.9% |
| Median | 5.3% | 7.5% |
| Interquartile 25% (IQ1) | 4.0% | 6.7% |
| Interquartile 75% (IQ3) | 7.1% | 11.0% |
| Interquartile Range (IQR) | 3.1% | 4.3% |
| Standard Deviation (Sample) | 2.9% | 6.8% |
| Standard Deviation (Population) | 2.8% | 6.7% |
Similar Demographics by Unemployment Among Women with Children Under 6 years
Demographics Similar to Immigrants from Eastern Asia by Unemployment Among Women with Children Under 6 years
In terms of unemployment among women with children under 6 years, the demographic groups most similar to Immigrants from Eastern Asia are Immigrants from Singapore (6.3%, a difference of 0.050%), Indian (Asian) (6.3%, a difference of 0.070%), Immigrants from Bulgaria (6.3%, a difference of 0.32%), Thai (6.3%, a difference of 0.42%), and Immigrants from Uzbekistan (6.3%, a difference of 0.72%).
| Demographics | Rating | Rank | Unemployment Among Women with Children Under 6 years |
| Immigrants | Taiwan | 100.0 /100 | #6 | Exceptional 6.0% |
| Taiwanese | 100.0 /100 | #7 | Exceptional 6.1% |
| Immigrants | India | 100.0 /100 | #8 | Exceptional 6.1% |
| Filipinos | 100.0 /100 | #9 | Exceptional 6.1% |
| Immigrants | China | 100.0 /100 | #10 | Exceptional 6.2% |
| Indians (Asian) | 100.0 /100 | #11 | Exceptional 6.3% |
| Immigrants | Singapore | 100.0 /100 | #12 | Exceptional 6.3% |
| Immigrants | Eastern Asia | 100.0 /100 | #13 | Exceptional 6.3% |
| Immigrants | Bulgaria | 100.0 /100 | #14 | Exceptional 6.3% |
| Thais | 100.0 /100 | #15 | Exceptional 6.3% |
| Immigrants | Uzbekistan | 100.0 /100 | #16 | Exceptional 6.3% |
| Immigrants | Malaysia | 100.0 /100 | #17 | Exceptional 6.4% |
| Assyrians/Chaldeans/Syriacs | 100.0 /100 | #18 | Exceptional 6.5% |
| Mongolians | 100.0 /100 | #19 | Exceptional 6.5% |
| Ute | 100.0 /100 | #20 | Exceptional 6.5% |
Demographics Similar to Immigrants from Peru by Unemployment Among Women with Children Under 6 years
In terms of unemployment among women with children under 6 years, the demographic groups most similar to Immigrants from Peru are Bangladeshi (7.5%, a difference of 0.010%), Uruguayan (7.5%, a difference of 0.020%), Northern European (7.5%, a difference of 0.050%), South American (7.5%, a difference of 0.070%), and Aleut (7.5%, a difference of 0.10%).
| Demographics | Rating | Rank | Unemployment Among Women with Children Under 6 years |
| Europeans | 79.1 /100 | #144 | Good 7.5% |
| Immigrants | Jordan | 78.9 /100 | #145 | Good 7.5% |
| Japanese | 78.9 /100 | #146 | Good 7.5% |
| Immigrants | Oceania | 78.4 /100 | #147 | Good 7.5% |
| Immigrants | Brazil | 77.3 /100 | #148 | Good 7.5% |
| Colombians | 76.1 /100 | #149 | Good 7.5% |
| Aleuts | 76.0 /100 | #150 | Good 7.5% |
| Immigrants | Peru | 74.9 /100 | #151 | Good 7.5% |
| Bangladeshis | 74.8 /100 | #152 | Good 7.5% |
| Uruguayans | 74.7 /100 | #153 | Good 7.5% |
| Northern Europeans | 74.3 /100 | #154 | Good 7.5% |
| South Americans | 74.1 /100 | #155 | Good 7.5% |
| Immigrants | Southern Europe | 73.2 /100 | #156 | Good 7.5% |
| Peruvians | 72.3 /100 | #157 | Good 7.5% |
| Croatians | 71.9 /100 | #158 | Good 7.5% |