Immigrants from Eastern Asia vs Immigrants from Panama Unemployment Among Ages 25 to 29 years

COMPARE

Immigrants from Eastern Asia
Race
Ancestry
AfghanAfricanAlaska NativeAlaskan AthabascanAlbanianAleutAlsatianAmericanApacheArabArapahoArgentineanArmenianAssyrian/Chaldean/SyriacAustralianAustrianBahamianBangladeshiBarbadianBasqueBelgianBelizeanBermudanBhutaneseBlackfeetBolivianBrazilianBritishBritish West IndianBulgarianBurmeseCajunCambodianCanadianCape VerdeanCarpatho RusynCelticCentral AmericanCentral American IndianCherokeeCheyenneChickasawChileanChineseChippewaChoctawColombianColvilleComancheCosta RicanCreeCreekCroatianCrowCubanCypriotCzechCzechoslovakianDanishDelawareDominicanDutchDutch West IndianEastern EuropeanEcuadorianEgyptianEnglishEstonianEthiopianEuropeanFijianFilipinoFinnishFrenchFrench American IndianFrench CanadianGermanGerman RussianGhanaianGreekGuamanian/ChamorroGuatemalanGuyaneseHaitianHmongHonduranHopiHoumaHungarianIcelanderIndian (Asian)IndonesianInupiatIranianIraqiIrishIroquoisIsraeliItalianJamaicanJapaneseJordanianKenyanKiowaKoreanLaotianLatvianLebaneseLiberianLithuanianLumbeeLuxembourgerMacedonianMalaysianMalteseMarshalleseMenomineeMexicanMexican American IndianMongolianMoroccanNative HawaiianNavajoNepaleseNew ZealanderNicaraguanNigerianNorthern EuropeanNorwegianOkinawanOsageOttawaPaiutePakistaniPalestinianPanamanianParaguayanPennsylvania GermanPeruvianPimaPolishPortuguesePotawatomiPuebloPuerto RicanPuget Sound SalishRomanianRussianSalvadoranSamoanScandinavianScotch-IrishScottishSeminoleSenegaleseSerbianShoshoneSierra LeoneanSiouxSlavicSlovakSloveneSomaliSouth AfricanSouth AmericanSouth American IndianSoviet UnionSpaniardSpanishSpanish AmericanSpanish American IndianSri LankanSubsaharan AfricanSudaneseSwedishSwissSyrianTaiwaneseThaiTlingit-HaidaTohono O'OdhamTonganTrinidadian and TobagonianTsimshianTurkishU.S. Virgin IslanderUgandanUkrainianUruguayanUteVenezuelanVietnameseWelshWest IndianYakamaYaquiYugoslavianYumanYup'ikZimbabwean
Immigration
NonimmigrantsImmigrantsAfghanistanAfricaAlbaniaArgentinaArmeniaAsiaAustraliaAustriaBahamasBangladeshBarbadosBelarusBelgiumBelizeBoliviaBosnia and HerzegovinaBrazilBulgariaBurma/MyanmarCabo VerdeCambodiaCameroonCanadaCaribbeanCentral AmericaChileChinaColombiaCongoCosta RicaCroatiaCubaCzechoslovakiaDenmarkDominicaDominican RepublicEastern AfricaEastern AsiaEastern EuropeEcuadorEgyptEl SalvadorEnglandEritreaEthiopiaEuropeFijiFranceGermanyGhanaGreeceGrenadaGuatemalaGuyanaHaitiHondurasHong KongHungaryIndiaIndonesiaIranIraqIrelandIsraelItalyJamaicaJapanJordanKazakhstanKenyaKoreaKuwaitLaosLatin AmericaLatviaLebanonLiberiaLithuaniaMalaysiaMexicoMicronesiaMiddle AfricaMoldovaMoroccoNepalNetherlandsNicaraguaNigeriaNorth AmericaNorth MacedoniaNorthern AfricaNorthern EuropeNorwayOceaniaPakistanPeruPhilippinesPolandPortugalRomaniaRussiaSaudi ArabiaScotlandSenegalSerbiaSierra LeoneSingaporeSomaliaSouth AfricaSouth AmericaSouth Central AsiaSouth Eastern AsiaSouthern EuropeSpainSri LankaSt. Vincent and the GrenadinesSudanSwedenSwitzerlandSyriaTaiwanThailandTrinidad and TobagoTurkeyUgandaUkraineUruguayUzbekistanVenezuelaVietnamWest IndiesWestern AfricaWestern AsiaWestern EuropeYemenZaireZimbabweAzores
Immigrants from Panama
Race
Ancestry
AfghanAfricanAlaska NativeAlaskan AthabascanAlbanianAleutAlsatianAmericanApacheArabArapahoArgentineanArmenianAssyrian/Chaldean/SyriacAustralianAustrianBahamianBangladeshiBarbadianBasqueBelgianBelizeanBermudanBhutaneseBlackfeetBolivianBrazilianBritishBritish West IndianBulgarianBurmeseCajunCambodianCanadianCape VerdeanCarpatho RusynCelticCentral AmericanCentral American IndianCherokeeCheyenneChickasawChileanChineseChippewaChoctawColombianColvilleComancheCosta RicanCreeCreekCroatianCrowCubanCypriotCzechCzechoslovakianDanishDelawareDominicanDutchDutch West IndianEastern EuropeanEcuadorianEgyptianEnglishEstonianEthiopianEuropeanFijianFilipinoFinnishFrenchFrench American IndianFrench CanadianGermanGerman RussianGhanaianGreekGuamanian/ChamorroGuatemalanGuyaneseHaitianHmongHonduranHopiHoumaHungarianIcelanderIndian (Asian)IndonesianInupiatIranianIraqiIrishIroquoisIsraeliItalianJamaicanJapaneseJordanianKenyanKiowaKoreanLaotianLatvianLebaneseLiberianLithuanianLumbeeLuxembourgerMacedonianMalaysianMalteseMarshalleseMenomineeMexicanMexican American IndianMongolianMoroccanNative HawaiianNavajoNepaleseNew ZealanderNicaraguanNigerianNorthern EuropeanNorwegianOkinawanOsageOttawaPaiutePakistaniPalestinianPanamanianParaguayanPennsylvania GermanPeruvianPimaPolishPortuguesePotawatomiPuebloPuerto RicanPuget Sound SalishRomanianRussianSalvadoranSamoanScandinavianScotch-IrishScottishSeminoleSenegaleseSerbianShoshoneSierra LeoneanSiouxSlavicSlovakSloveneSomaliSouth AfricanSouth AmericanSouth American IndianSoviet UnionSpaniardSpanishSpanish AmericanSpanish American IndianSri LankanSubsaharan AfricanSudaneseSwedishSwissSyrianTaiwaneseThaiTlingit-HaidaTohono O'OdhamTonganTrinidadian and TobagonianTsimshianTurkishU.S. Virgin IslanderUgandanUkrainianUruguayanUteVenezuelanVietnameseWelshWest IndianYakamaYaquiYugoslavianYumanYup'ikZimbabwean
Immigration
NonimmigrantsImmigrantsAfghanistanAfricaAlbaniaArgentinaArmeniaAsiaAustraliaAustriaBahamasBangladeshBarbadosBelarusBelgiumBelizeBoliviaBosnia and HerzegovinaBrazilBulgariaBurma/MyanmarCabo VerdeCambodiaCameroonCanadaCaribbeanCentral AmericaChileChinaColombiaCongoCosta RicaCroatiaCubaCzechoslovakiaDenmarkDominicaDominican RepublicEastern AfricaEastern EuropeEcuadorEgyptEl SalvadorEnglandEritreaEthiopiaEuropeFijiFranceGermanyGhanaGreeceGrenadaGuatemalaGuyanaHaitiHondurasHong KongHungaryIndiaIndonesiaIranIraqIrelandIsraelItalyJamaicaJapanJordanKazakhstanKenyaKoreaKuwaitLaosLatin AmericaLatviaLebanonLiberiaLithuaniaMalaysiaMexicoMicronesiaMiddle AfricaMoldovaMoroccoNepalNetherlandsNicaraguaNigeriaNorth AmericaNorth MacedoniaNorthern AfricaNorthern EuropeNorwayOceaniaPakistanPanamaPeruPhilippinesPolandPortugalRomaniaRussiaSaudi ArabiaScotlandSenegalSerbiaSierra LeoneSingaporeSomaliaSouth AfricaSouth AmericaSouth Central AsiaSouth Eastern AsiaSouthern EuropeSpainSri LankaSt. Vincent and the GrenadinesSudanSwedenSwitzerlandSyriaTaiwanThailandTrinidad and TobagoTurkeyUgandaUkraineUruguayUzbekistanVenezuelaVietnamWest IndiesWestern AfricaWestern AsiaWestern EuropeYemenZaireZimbabweAzores
Unemployment Among Ages 25 to 29 years
Income
Poverty
Unemployment
Labor Participation
Family Structure
Vehicle Availability
Education Level
Disability

Unemployment Among Ages 25 to 29 years Comparison

Immigrants from Eastern Asia

Immigrants from Panama

Exceptional
Tragic
6.2%
UNEMPLOYMENT AMONG AGES 25 TO 29 YEARS
98.4/ 100
METRIC RATING
58th/ 347
METRIC RANK
7.0%
UNEMPLOYMENT AMONG AGES 25 TO 29 YEARS
4.2/ 100
METRIC RATING
228th/ 347
METRIC RANK

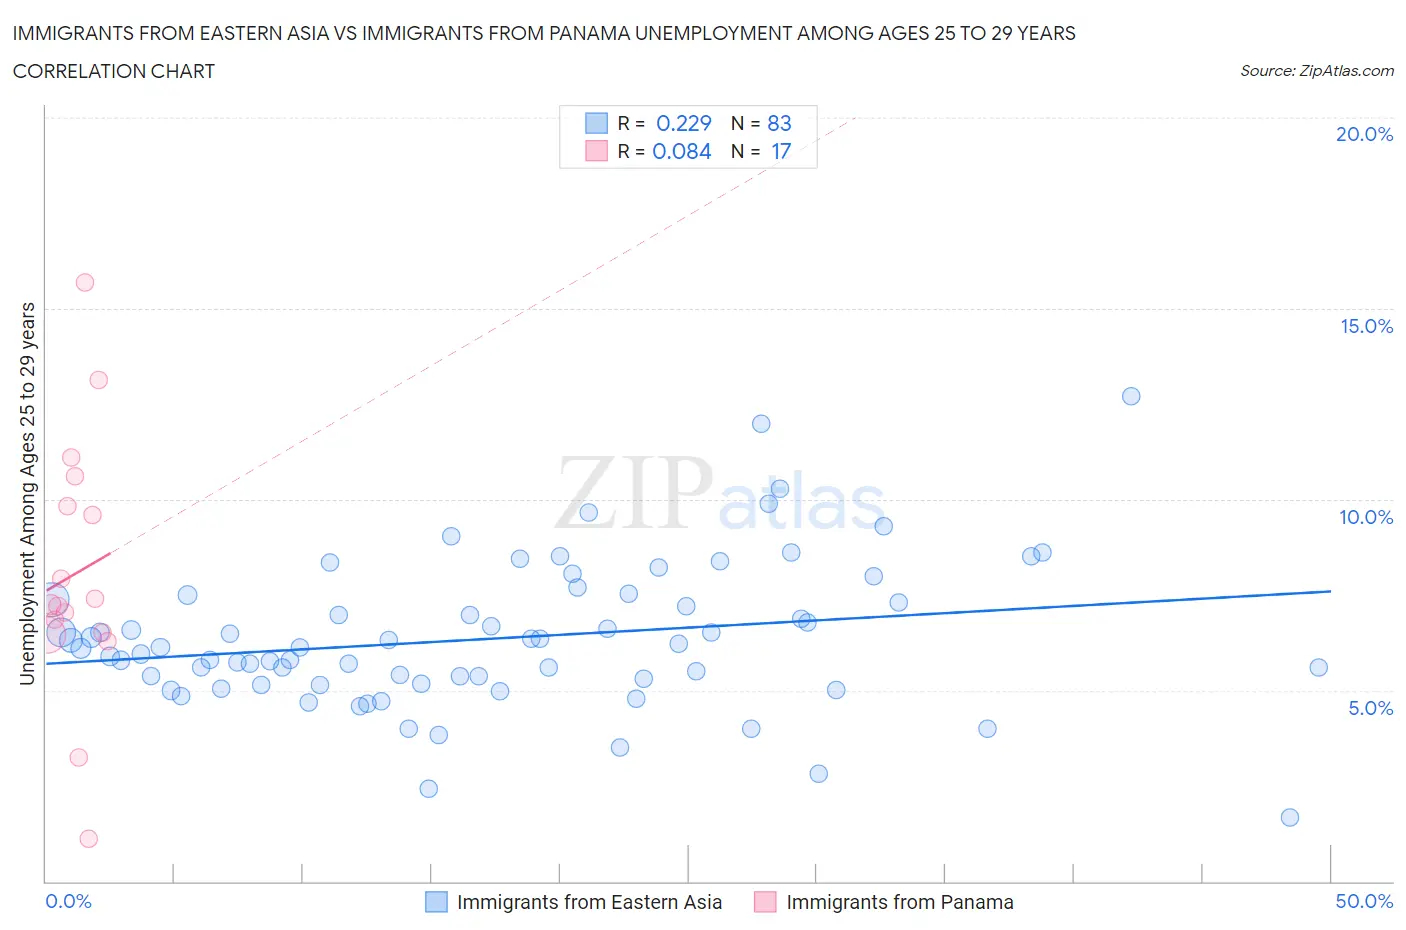
Immigrants from Eastern Asia vs Immigrants from Panama Unemployment Among Ages 25 to 29 years Correlation Chart

The statistical analysis conducted on geographies consisting of 463,815,743 people shows a weak positive correlation between the proportion of Immigrants from Eastern Asia and unemployment rate among population between the ages 25 and 29 in the United States with a correlation coefficient (R) of 0.229 and weighted average of 6.2%. Similarly, the statistical analysis conducted on geographies consisting of 215,911,091 people shows a slight positive correlation between the proportion of Immigrants from Panama and unemployment rate among population between the ages 25 and 29 in the United States with a correlation coefficient (R) of 0.084 and weighted average of 7.0%, a difference of 12.0%.
Immigrants from Eastern Asia vs Immigrants from Panama Unemployment Among Ages 25 to 29 years

Unemployment Among Ages 25 to 29 years Correlation Summary

MeasurementImmigrants from Eastern AsiaImmigrants from Panama
Minimum1.7%1.1%
Maximum12.7%15.7%
Range11.0%14.6%
Mean6.4%8.1%
Median6.1%7.2%
Interquartile 25% (IQ1)5.2%6.5%
Interquartile 75% (IQ3)7.4%10.2%
Interquartile Range (IQR)2.2%3.7%
Standard Deviation (Sample)1.9%3.4%
Standard Deviation (Population)1.9%3.3%

Similar Demographics by Unemployment Among Ages 25 to 29 years

Demographics Similar to Immigrants from Eastern Asia by Unemployment Among Ages 25 to 29 years

In terms of unemployment among ages 25 to 29 years, the demographic groups most similar to Immigrants from Eastern Asia are Luxembourger (6.2%, a difference of 0.13%), Immigrants from Taiwan (6.2%, a difference of 0.15%), Immigrants from Saudi Arabia (6.2%, a difference of 0.16%), Immigrants from Burma/Myanmar (6.2%, a difference of 0.25%), and Immigrants from Netherlands (6.2%, a difference of 0.27%).
DemographicsRating | RankUnemployment Among Ages 25 to 29 years
Burmese
98.9
/100
|
#51
Exceptional
6.2%
Immigrants | Turkey
98.9
/100
|
#52
Exceptional
6.2%
Turks
98.8
/100
|
#53
Exceptional
6.2%
Swedes
98.8
/100
|
#54
Exceptional
6.2%
Immigrants | Netherlands
98.7
/100
|
#55
Exceptional
6.2%
Immigrants | Burma/Myanmar
98.7
/100
|
#56
Exceptional
6.2%
Immigrants | Saudi Arabia
98.6
/100
|
#57
Exceptional
6.2%
Immigrants | Eastern Asia
98.4
/100
|
#58
Exceptional
6.2%
Luxembourgers
98.3
/100
|
#59
Exceptional
6.2%
Immigrants | Taiwan
98.3
/100
|
#60
Exceptional
6.2%
Bhutanese
98.2
/100
|
#61
Exceptional
6.2%
Immigrants | China
98.1
/100
|
#62
Exceptional
6.2%
Kenyans
98.0
/100
|
#63
Exceptional
6.3%
Immigrants | Sri Lanka
97.9
/100
|
#64
Exceptional
6.3%
Immigrants | Lebanon
97.8
/100
|
#65
Exceptional
6.3%

Demographics Similar to Immigrants from Panama by Unemployment Among Ages 25 to 29 years

In terms of unemployment among ages 25 to 29 years, the demographic groups most similar to Immigrants from Panama are Salvadoran (7.0%, a difference of 0.050%), Bermudan (7.0%, a difference of 0.15%), Immigrants from Liberia (7.0%, a difference of 0.18%), Immigrants from El Salvador (7.0%, a difference of 0.23%), and Japanese (6.9%, a difference of 0.38%).
DemographicsRating | RankUnemployment Among Ages 25 to 29 years
Israelis
9.8
/100
|
#221
Tragic
6.9%
Spaniards
7.7
/100
|
#222
Tragic
6.9%
Celtics
7.6
/100
|
#223
Tragic
6.9%
Immigrants | Immigrants
6.2
/100
|
#224
Tragic
6.9%
Japanese
5.4
/100
|
#225
Tragic
6.9%
Immigrants | Liberia
4.8
/100
|
#226
Tragic
7.0%
Salvadorans
4.4
/100
|
#227
Tragic
7.0%
Immigrants | Panama
4.2
/100
|
#228
Tragic
7.0%
Bermudans
3.8
/100
|
#229
Tragic
7.0%
Immigrants | El Salvador
3.6
/100
|
#230
Tragic
7.0%
Central Americans
3.0
/100
|
#231
Tragic
7.0%
Spanish Americans
2.7
/100
|
#232
Tragic
7.0%
Immigrants | Honduras
2.4
/100
|
#233
Tragic
7.0%
French Canadians
2.4
/100
|
#234
Tragic
7.0%
Panamanians
2.1
/100
|
#235
Tragic
7.0%