Immigrants from Eastern Africa vs Taiwanese Unemployment Among Ages 45 to 54 years
COMPARE
Immigrants from Eastern Africa
Taiwanese
Unemployment Among Ages 45 to 54 years
Unemployment Among Ages 45 to 54 years Comparison
Immigrants from Eastern Africa
Taiwanese
4.4%
UNEMPLOYMENT AMONG AGES 45 TO 54 YEARS
85.1/ 100
METRIC RATING
132nd/ 347
METRIC RANK
4.5%
UNEMPLOYMENT AMONG AGES 45 TO 54 YEARS
77.9/ 100
METRIC RATING
144th/ 347
METRIC RANK
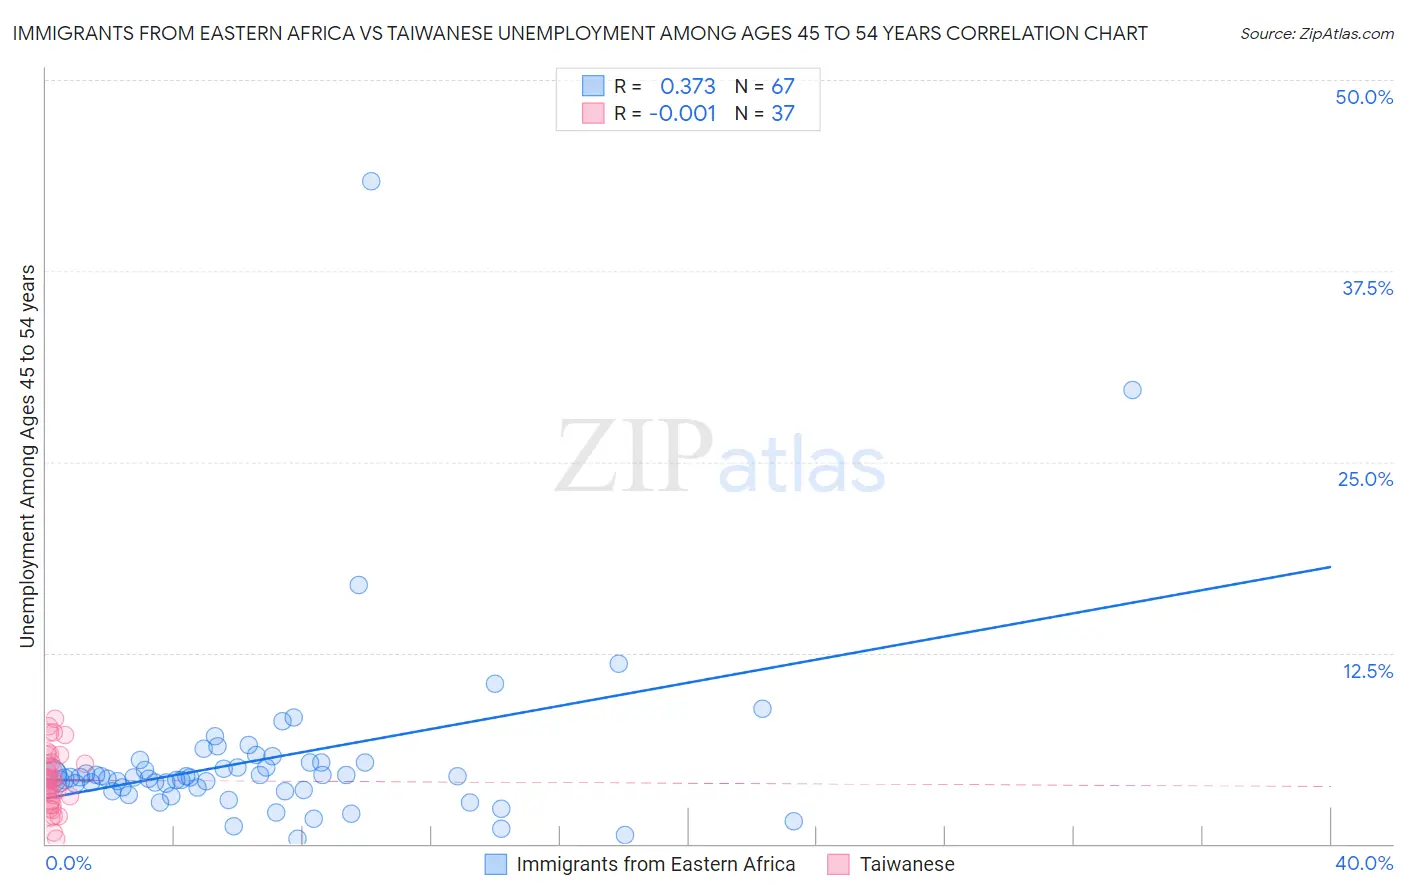
Immigrants from Eastern Africa vs Taiwanese Unemployment Among Ages 45 to 54 years Correlation Chart
The statistical analysis conducted on geographies consisting of 348,118,398 people shows a mild positive correlation between the proportion of Immigrants from Eastern Africa and unemployment rate among population between the ages 45 and 54 in the United States with a correlation coefficient (R) of 0.373 and weighted average of 4.4%. Similarly, the statistical analysis conducted on geographies consisting of 31,677,040 people shows no correlation between the proportion of Taiwanese and unemployment rate among population between the ages 45 and 54 in the United States with a correlation coefficient (R) of -0.001 and weighted average of 4.5%, a difference of 0.57%.
Unemployment Among Ages 45 to 54 years Correlation Summary
| Measurement | Immigrants from Eastern Africa | Taiwanese |
| Minimum | 0.30% | 0.30% |
| Maximum | 43.4% | 8.2% |
| Range | 43.1% | 7.9% |
| Mean | 5.6% | 4.2% |
| Median | 4.3% | 4.1% |
| Interquartile 25% (IQ1) | 3.5% | 2.7% |
| Interquartile 75% (IQ3) | 5.3% | 5.5% |
| Interquartile Range (IQR) | 1.8% | 2.9% |
| Standard Deviation (Sample) | 6.1% | 1.9% |
| Standard Deviation (Population) | 6.1% | 1.9% |
Demographics Similar to Immigrants from Eastern Africa and Taiwanese by Unemployment Among Ages 45 to 54 years
In terms of unemployment among ages 45 to 54 years, the demographic groups most similar to Immigrants from Eastern Africa are Immigrants from Cameroon (4.4%, a difference of 0.030%), Afghan (4.4%, a difference of 0.050%), Immigrants from Germany (4.4%, a difference of 0.080%), Immigrants from Eastern Asia (4.4%, a difference of 0.10%), and Celtic (4.4%, a difference of 0.11%). Similarly, the demographic groups most similar to Taiwanese are Immigrants from Latvia (4.5%, a difference of 0.030%), Syrian (4.5%, a difference of 0.040%), Uruguayan (4.5%, a difference of 0.070%), Macedonian (4.5%, a difference of 0.080%), and Immigrants from Netherlands (4.4%, a difference of 0.11%).
| Demographics | Rating | Rank | Unemployment Among Ages 45 to 54 years |
| Immigrants | Northern Europe | 86.9 /100 | #128 | Excellent 4.4% |
| Laotians | 86.3 /100 | #129 | Excellent 4.4% |
| Celtics | 86.2 /100 | #130 | Excellent 4.4% |
| Immigrants | Germany | 85.9 /100 | #131 | Excellent 4.4% |
| Immigrants | Eastern Africa | 85.1 /100 | #132 | Excellent 4.4% |
| Immigrants | Cameroon | 84.8 /100 | #133 | Excellent 4.4% |
| Afghans | 84.6 /100 | #134 | Excellent 4.4% |
| Immigrants | Eastern Asia | 84.0 /100 | #135 | Excellent 4.4% |
| Immigrants | Middle Africa | 83.3 /100 | #136 | Excellent 4.4% |
| Lebanese | 81.9 /100 | #137 | Excellent 4.4% |
| Immigrants | Congo | 81.8 /100 | #138 | Excellent 4.4% |
| Immigrants | Kuwait | 81.7 /100 | #139 | Excellent 4.4% |
| Immigrants | Zaire | 80.7 /100 | #140 | Excellent 4.4% |
| Immigrants | Afghanistan | 79.6 /100 | #141 | Good 4.4% |
| Immigrants | Netherlands | 79.4 /100 | #142 | Good 4.4% |
| Macedonians | 79.0 /100 | #143 | Good 4.5% |
| Taiwanese | 77.9 /100 | #144 | Good 4.5% |
| Immigrants | Latvia | 77.5 /100 | #145 | Good 4.5% |
| Syrians | 77.3 /100 | #146 | Good 4.5% |
| Uruguayans | 76.9 /100 | #147 | Good 4.5% |
| Immigrants | Austria | 75.3 /100 | #148 | Good 4.5% |