Immigrants from Eastern Africa vs Chippewa Unemployment Among Seniors over 75 years
COMPARE
Immigrants from Eastern Africa
Chippewa
Unemployment Among Seniors over 75 years
Unemployment Among Seniors over 75 years Comparison
Immigrants from Eastern Africa
Chippewa
8.7%
UNEMPLOYMENT AMONG SENIORS OVER 75 YEARS
57.6/ 100
METRIC RATING
167th/ 347
METRIC RANK
10.1%
UNEMPLOYMENT AMONG SENIORS OVER 75 YEARS
0.0/ 100
METRIC RATING
312th/ 347
METRIC RANK
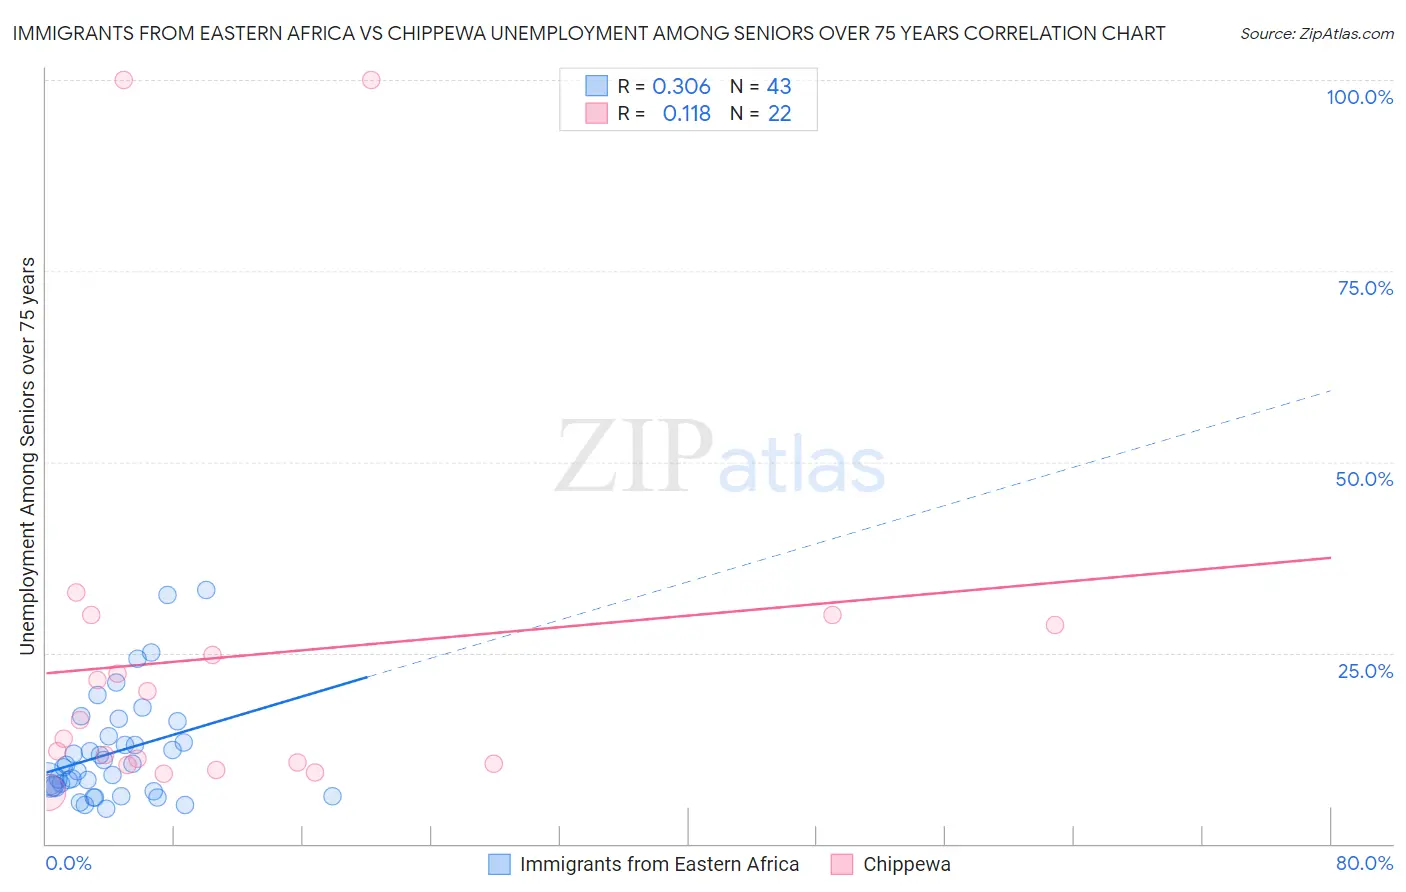
Immigrants from Eastern Africa vs Chippewa Unemployment Among Seniors over 75 years Correlation Chart
The statistical analysis conducted on geographies consisting of 189,663,738 people shows a mild positive correlation between the proportion of Immigrants from Eastern Africa and unemployment rate among seniors over the age of 75 in the United States with a correlation coefficient (R) of 0.306 and weighted average of 8.7%. Similarly, the statistical analysis conducted on geographies consisting of 127,025,667 people shows a poor positive correlation between the proportion of Chippewa and unemployment rate among seniors over the age of 75 in the United States with a correlation coefficient (R) of 0.118 and weighted average of 10.1%, a difference of 16.0%.
Unemployment Among Seniors over 75 years Correlation Summary
| Measurement | Immigrants from Eastern Africa | Chippewa |
| Minimum | 4.6% | 6.8% |
| Maximum | 33.3% | 100.0% |
| Range | 28.7% | 93.2% |
| Mean | 12.0% | 24.6% |
| Median | 10.0% | 15.0% |
| Interquartile 25% (IQ1) | 7.5% | 10.5% |
| Interquartile 75% (IQ3) | 14.1% | 28.6% |
| Interquartile Range (IQR) | 6.6% | 18.1% |
| Standard Deviation (Sample) | 6.9% | 25.7% |
| Standard Deviation (Population) | 6.8% | 25.1% |
Similar Demographics by Unemployment Among Seniors over 75 years
Demographics Similar to Immigrants from Eastern Africa by Unemployment Among Seniors over 75 years
In terms of unemployment among seniors over 75 years, the demographic groups most similar to Immigrants from Eastern Africa are Immigrants from Belize (8.7%, a difference of 0.0%), Immigrants from Lithuania (8.7%, a difference of 0.020%), Fijian (8.7%, a difference of 0.060%), Zimbabwean (8.7%, a difference of 0.19%), and Immigrants from Dominican Republic (8.7%, a difference of 0.21%).
| Demographics | Rating | Rank | Unemployment Among Seniors over 75 years |
| Cree | 72.8 /100 | #160 | Good 8.6% |
| Albanians | 72.8 /100 | #161 | Good 8.6% |
| Immigrants | South America | 71.3 /100 | #162 | Good 8.6% |
| Immigrants | Guatemala | 68.4 /100 | #163 | Good 8.7% |
| Paraguayans | 62.2 /100 | #164 | Good 8.7% |
| Immigrants | Dominican Republic | 61.4 /100 | #165 | Good 8.7% |
| Immigrants | Belize | 57.6 /100 | #166 | Average 8.7% |
| Immigrants | Eastern Africa | 57.6 /100 | #167 | Average 8.7% |
| Immigrants | Lithuania | 57.2 /100 | #168 | Average 8.7% |
| Fijians | 56.4 /100 | #169 | Average 8.7% |
| Zimbabweans | 54.1 /100 | #170 | Average 8.7% |
| Dominicans | 51.9 /100 | #171 | Average 8.7% |
| Immigrants | Immigrants | 51.8 /100 | #172 | Average 8.7% |
| Australians | 50.3 /100 | #173 | Average 8.7% |
| Immigrants | El Salvador | 49.7 /100 | #174 | Average 8.7% |
Demographics Similar to Chippewa by Unemployment Among Seniors over 75 years
In terms of unemployment among seniors over 75 years, the demographic groups most similar to Chippewa are Scottish (10.1%, a difference of 0.010%), Nepalese (10.1%, a difference of 0.12%), Hungarian (10.1%, a difference of 0.13%), English (10.1%, a difference of 0.31%), and White/Caucasian (10.1%, a difference of 0.38%).
| Demographics | Rating | Rank | Unemployment Among Seniors over 75 years |
| Swedes | 0.0 /100 | #305 | Tragic 10.0% |
| Italians | 0.0 /100 | #306 | Tragic 10.0% |
| Immigrants | Fiji | 0.0 /100 | #307 | Tragic 10.0% |
| Whites/Caucasians | 0.0 /100 | #308 | Tragic 10.1% |
| English | 0.0 /100 | #309 | Tragic 10.1% |
| Hungarians | 0.0 /100 | #310 | Tragic 10.1% |
| Scottish | 0.0 /100 | #311 | Tragic 10.1% |
| Chippewa | 0.0 /100 | #312 | Tragic 10.1% |
| Nepalese | 0.0 /100 | #313 | Tragic 10.1% |
| Dutch West Indians | 0.0 /100 | #314 | Tragic 10.2% |
| Pennsylvania Germans | 0.0 /100 | #315 | Tragic 10.2% |
| Natives/Alaskans | 0.0 /100 | #316 | Tragic 10.2% |
| Irish | 0.0 /100 | #317 | Tragic 10.2% |
| Liberians | 0.0 /100 | #318 | Tragic 10.2% |
| Germans | 0.0 /100 | #319 | Tragic 10.3% |