Immigrants from Dominican Republic vs Malaysian Male Unemployment
COMPARE
Immigrants from Dominican Republic
Malaysian
Male Unemployment
Male Unemployment Comparison
Immigrants from Dominican Republic
Malaysians
7.6%
MALE UNEMPLOYMENT
0.0/ 100
METRIC RATING
326th/ 347
METRIC RANK
5.3%
MALE UNEMPLOYMENT
39.6/ 100
METRIC RATING
180th/ 347
METRIC RANK
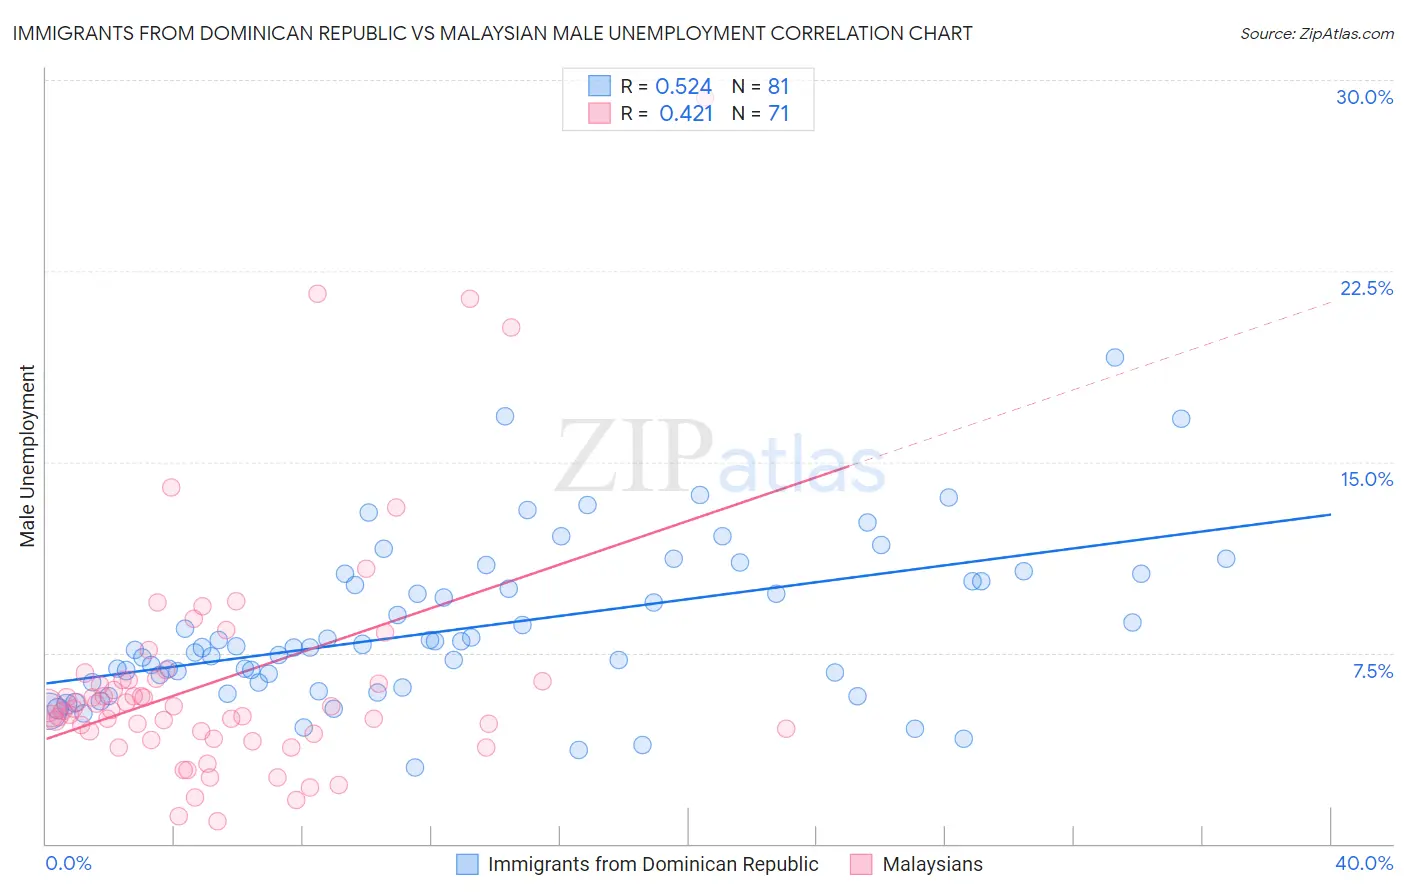
Immigrants from Dominican Republic vs Malaysian Male Unemployment Correlation Chart
The statistical analysis conducted on geographies consisting of 274,236,953 people shows a substantial positive correlation between the proportion of Immigrants from Dominican Republic and unemployment rate among males in the United States with a correlation coefficient (R) of 0.524 and weighted average of 7.6%. Similarly, the statistical analysis conducted on geographies consisting of 225,737,190 people shows a moderate positive correlation between the proportion of Malaysians and unemployment rate among males in the United States with a correlation coefficient (R) of 0.421 and weighted average of 5.3%, a difference of 42.8%.
Male Unemployment Correlation Summary
| Measurement | Immigrants from Dominican Republic | Malaysian |
| Minimum | 3.0% | 0.90% |
| Maximum | 19.1% | 29.3% |
| Range | 16.1% | 28.4% |
| Mean | 8.5% | 6.4% |
| Median | 7.7% | 5.3% |
| Interquartile 25% (IQ1) | 6.3% | 4.3% |
| Interquartile 75% (IQ3) | 10.5% | 6.4% |
| Interquartile Range (IQR) | 4.1% | 2.1% |
| Standard Deviation (Sample) | 3.1% | 4.8% |
| Standard Deviation (Population) | 3.1% | 4.8% |
Similar Demographics by Male Unemployment
Demographics Similar to Immigrants from Dominican Republic by Male Unemployment
In terms of male unemployment, the demographic groups most similar to Immigrants from Dominican Republic are Shoshone (7.6%, a difference of 0.10%), Dominican (7.6%, a difference of 0.48%), Immigrants from Grenada (7.6%, a difference of 0.75%), Paiute (7.7%, a difference of 1.1%), and Native/Alaskan (7.7%, a difference of 1.5%).
| Demographics | Rating | Rank | Male Unemployment |
| British West Indians | 0.0 /100 | #319 | Tragic 7.3% |
| Colville | 0.0 /100 | #320 | Tragic 7.4% |
| Immigrants | St. Vincent and the Grenadines | 0.0 /100 | #321 | Tragic 7.5% |
| Immigrants | Cabo Verde | 0.0 /100 | #322 | Tragic 7.5% |
| Immigrants | Grenada | 0.0 /100 | #323 | Tragic 7.6% |
| Dominicans | 0.0 /100 | #324 | Tragic 7.6% |
| Shoshone | 0.0 /100 | #325 | Tragic 7.6% |
| Immigrants | Dominican Republic | 0.0 /100 | #326 | Tragic 7.6% |
| Paiute | 0.0 /100 | #327 | Tragic 7.7% |
| Natives/Alaskans | 0.0 /100 | #328 | Tragic 7.7% |
| Immigrants | Yemen | 0.0 /100 | #329 | Tragic 7.8% |
| Yakama | 0.0 /100 | #330 | Tragic 7.9% |
| Alaska Natives | 0.0 /100 | #331 | Tragic 8.1% |
| Pima | 0.0 /100 | #332 | Tragic 8.3% |
| Sioux | 0.0 /100 | #333 | Tragic 8.4% |
Demographics Similar to Malaysians by Male Unemployment
In terms of male unemployment, the demographic groups most similar to Malaysians are Immigrants from Oceania (5.3%, a difference of 0.070%), Immigrants from Afghanistan (5.3%, a difference of 0.10%), Potawatomi (5.3%, a difference of 0.11%), Taiwanese (5.3%, a difference of 0.12%), and Osage (5.3%, a difference of 0.17%).
| Demographics | Rating | Rank | Male Unemployment |
| Immigrants | Russia | 50.7 /100 | #173 | Average 5.3% |
| Immigrants | Iran | 50.0 /100 | #174 | Average 5.3% |
| Immigrants | Iraq | 48.1 /100 | #175 | Average 5.3% |
| Immigrants | Poland | 46.0 /100 | #176 | Average 5.3% |
| Immigrants | Peru | 44.6 /100 | #177 | Average 5.3% |
| Osage | 42.5 /100 | #178 | Average 5.3% |
| Immigrants | Oceania | 40.8 /100 | #179 | Average 5.3% |
| Malaysians | 39.6 /100 | #180 | Fair 5.3% |
| Immigrants | Afghanistan | 37.9 /100 | #181 | Fair 5.3% |
| Potawatomi | 37.8 /100 | #182 | Fair 5.3% |
| Taiwanese | 37.6 /100 | #183 | Fair 5.3% |
| Spaniards | 35.1 /100 | #184 | Fair 5.3% |
| Koreans | 34.9 /100 | #185 | Fair 5.3% |
| Iraqis | 31.6 /100 | #186 | Fair 5.4% |
| Costa Ricans | 31.3 /100 | #187 | Fair 5.4% |