Immigrants from Dominican Republic vs Immigrants from Cambodia Unemployment Among Women with Children Under 6 years
COMPARE
Immigrants from Dominican Republic
Immigrants from Cambodia
Unemployment Among Women with Children Under 6 years
Unemployment Among Women with Children Under 6 years Comparison
Immigrants from Dominican Republic
Immigrants from Cambodia
8.9%
UNEMPLOYMENT AMONG WOMEN WITH CHILDREN UNDER 6 YEARS
0.0/ 100
METRIC RATING
296th/ 347
METRIC RANK
7.4%
UNEMPLOYMENT AMONG WOMEN WITH CHILDREN UNDER 6 YEARS
84.6/ 100
METRIC RATING
137th/ 347
METRIC RANK
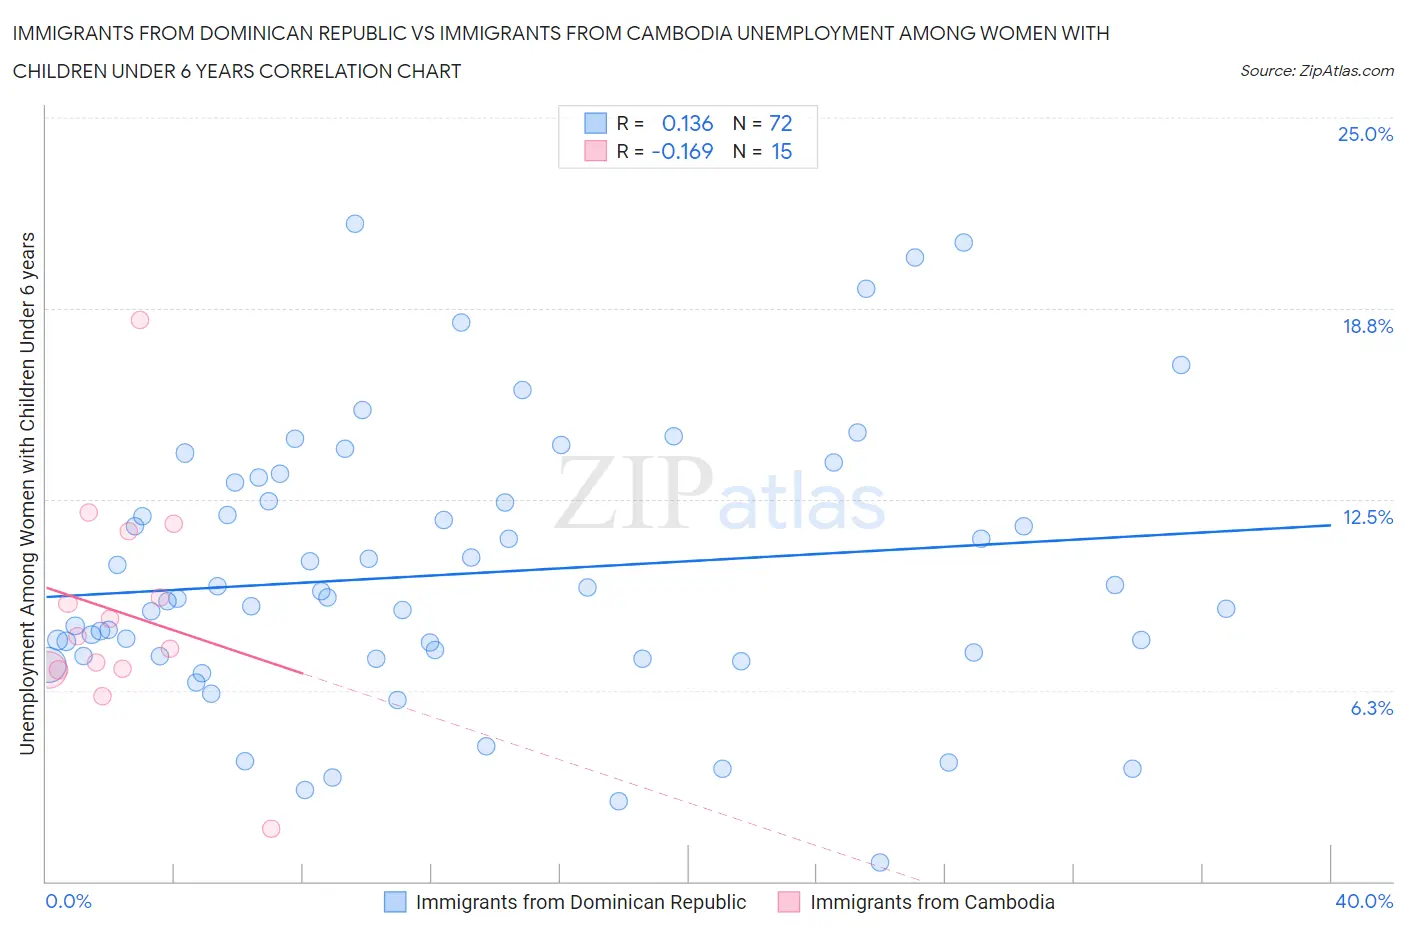
Immigrants from Dominican Republic vs Immigrants from Cambodia Unemployment Among Women with Children Under 6 years Correlation Chart
The statistical analysis conducted on geographies consisting of 221,187,094 people shows a poor positive correlation between the proportion of Immigrants from Dominican Republic and unemployment rate among women with children under the age of 6 in the United States with a correlation coefficient (R) of 0.136 and weighted average of 8.9%. Similarly, the statistical analysis conducted on geographies consisting of 176,492,322 people shows a poor negative correlation between the proportion of Immigrants from Cambodia and unemployment rate among women with children under the age of 6 in the United States with a correlation coefficient (R) of -0.169 and weighted average of 7.4%, a difference of 19.3%.
Unemployment Among Women with Children Under 6 years Correlation Summary
| Measurement | Immigrants from Dominican Republic | Immigrants from Cambodia |
| Minimum | 0.60% | 1.7% |
| Maximum | 21.5% | 18.4% |
| Range | 20.9% | 16.7% |
| Mean | 10.1% | 8.8% |
| Median | 9.3% | 8.0% |
| Interquartile 25% (IQ1) | 7.4% | 6.9% |
| Interquartile 75% (IQ3) | 12.8% | 11.5% |
| Interquartile Range (IQR) | 5.4% | 4.5% |
| Standard Deviation (Sample) | 4.4% | 3.7% |
| Standard Deviation (Population) | 4.4% | 3.6% |
Similar Demographics by Unemployment Among Women with Children Under 6 years
Demographics Similar to Immigrants from Dominican Republic by Unemployment Among Women with Children Under 6 years
In terms of unemployment among women with children under 6 years, the demographic groups most similar to Immigrants from Dominican Republic are Mexican (8.9%, a difference of 0.10%), Immigrants from Central America (8.9%, a difference of 0.13%), Nonimmigrants (8.8%, a difference of 0.18%), Tlingit-Haida (8.9%, a difference of 0.25%), and Immigrants from Bangladesh (8.8%, a difference of 0.36%).
| Demographics | Rating | Rank | Unemployment Among Women with Children Under 6 years |
| Iroquois | 0.0 /100 | #289 | Tragic 8.7% |
| Vietnamese | 0.0 /100 | #290 | Tragic 8.8% |
| Jamaicans | 0.0 /100 | #291 | Tragic 8.8% |
| Cheyenne | 0.0 /100 | #292 | Tragic 8.8% |
| Immigrants | Bangladesh | 0.0 /100 | #293 | Tragic 8.8% |
| Immigrants | Nonimmigrants | 0.0 /100 | #294 | Tragic 8.8% |
| Immigrants | Central America | 0.0 /100 | #295 | Tragic 8.9% |
| Immigrants | Dominican Republic | 0.0 /100 | #296 | Tragic 8.9% |
| Mexicans | 0.0 /100 | #297 | Tragic 8.9% |
| Tlingit-Haida | 0.0 /100 | #298 | Tragic 8.9% |
| Immigrants | Jamaica | 0.0 /100 | #299 | Tragic 8.9% |
| Creek | 0.0 /100 | #300 | Tragic 8.9% |
| Chickasaw | 0.0 /100 | #301 | Tragic 9.0% |
| Hispanics or Latinos | 0.0 /100 | #302 | Tragic 9.0% |
| Immigrants | West Indies | 0.0 /100 | #303 | Tragic 9.0% |
Demographics Similar to Immigrants from Cambodia by Unemployment Among Women with Children Under 6 years
In terms of unemployment among women with children under 6 years, the demographic groups most similar to Immigrants from Cambodia are Immigrants from Morocco (7.4%, a difference of 0.030%), Immigrants from Norway (7.4%, a difference of 0.070%), Immigrants from Northern Africa (7.4%, a difference of 0.090%), Immigrants from Colombia (7.4%, a difference of 0.090%), and Immigrants from Bolivia (7.4%, a difference of 0.15%).
| Demographics | Rating | Rank | Unemployment Among Women with Children Under 6 years |
| Swedes | 88.4 /100 | #130 | Excellent 7.4% |
| Ukrainians | 88.2 /100 | #131 | Excellent 7.4% |
| Immigrants | Armenia | 87.4 /100 | #132 | Excellent 7.4% |
| Immigrants | Uganda | 86.5 /100 | #133 | Excellent 7.4% |
| Immigrants | Bolivia | 85.7 /100 | #134 | Excellent 7.4% |
| Immigrants | Northern Africa | 85.3 /100 | #135 | Excellent 7.4% |
| Immigrants | Morocco | 84.9 /100 | #136 | Excellent 7.4% |
| Immigrants | Cambodia | 84.6 /100 | #137 | Excellent 7.4% |
| Immigrants | Norway | 84.1 /100 | #138 | Excellent 7.4% |
| Immigrants | Colombia | 83.9 /100 | #139 | Excellent 7.4% |
| Scandinavians | 83.0 /100 | #140 | Excellent 7.4% |
| Greeks | 82.6 /100 | #141 | Excellent 7.4% |
| Immigrants | Argentina | 81.5 /100 | #142 | Excellent 7.5% |
| Koreans | 81.3 /100 | #143 | Excellent 7.5% |
| Europeans | 79.1 /100 | #144 | Good 7.5% |