Immigrants from Dominica vs Trinidadian and Tobagonian Unemployment Among Seniors over 75 years
COMPARE
Immigrants from Dominica
Trinidadian and Tobagonian
Unemployment Among Seniors over 75 years
Unemployment Among Seniors over 75 years Comparison
Immigrants from Dominica
Trinidadians and Tobagonians
9.8%
UNEMPLOYMENT AMONG SENIORS OVER 75 YEARS
0.0/ 100
METRIC RATING
294th/ 347
METRIC RANK
8.3%
UNEMPLOYMENT AMONG SENIORS OVER 75 YEARS
98.4/ 100
METRIC RATING
114th/ 347
METRIC RANK
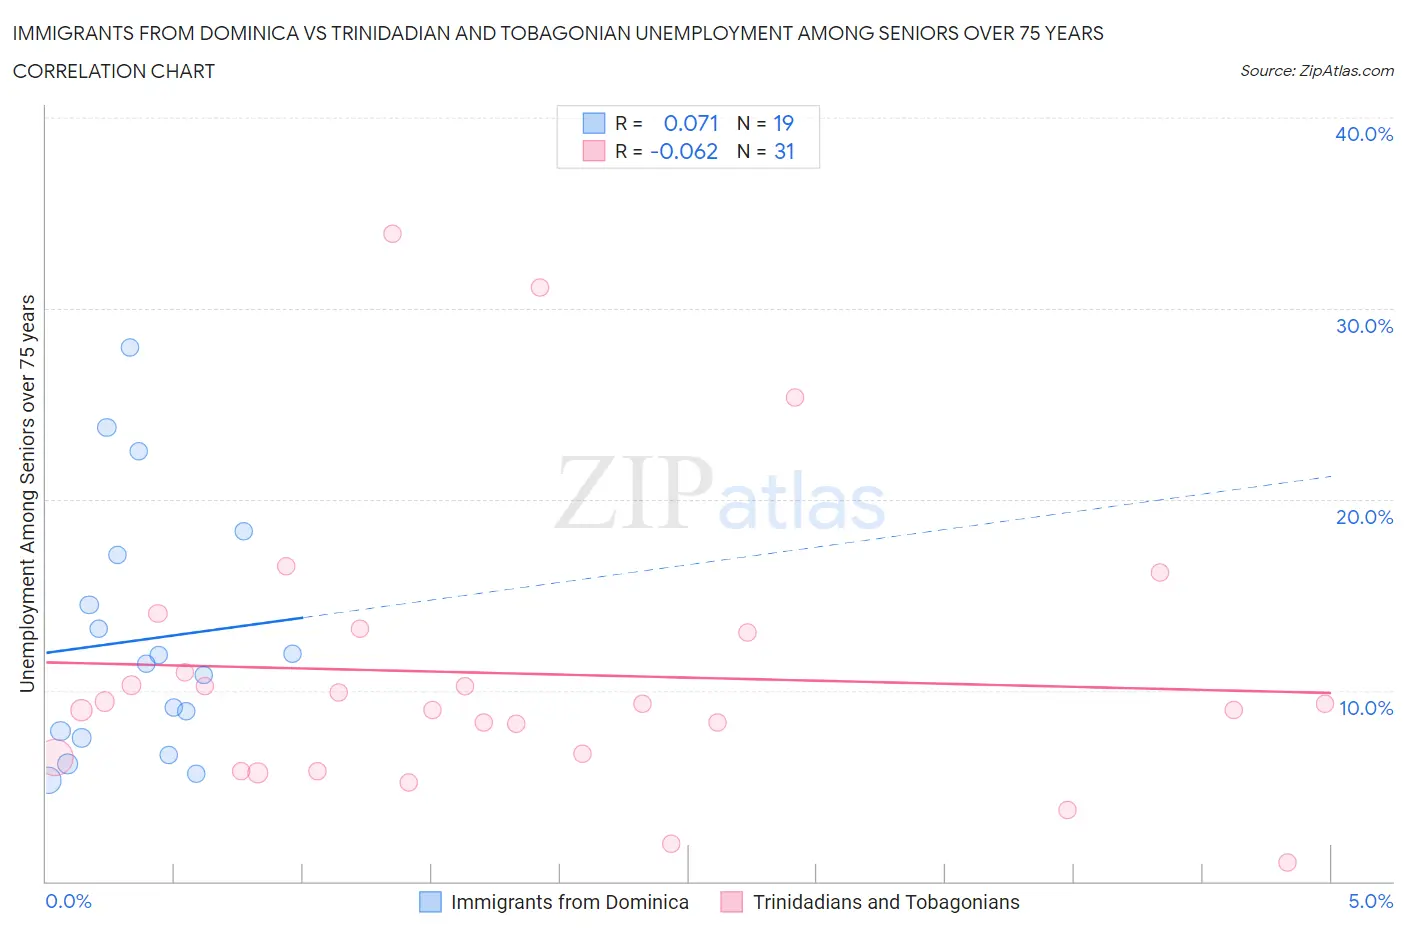
Immigrants from Dominica vs Trinidadian and Tobagonian Unemployment Among Seniors over 75 years Correlation Chart
The statistical analysis conducted on geographies consisting of 63,250,928 people shows a slight positive correlation between the proportion of Immigrants from Dominica and unemployment rate among seniors over the age of 75 in the United States with a correlation coefficient (R) of 0.071 and weighted average of 9.8%. Similarly, the statistical analysis conducted on geographies consisting of 137,167,796 people shows a slight negative correlation between the proportion of Trinidadians and Tobagonians and unemployment rate among seniors over the age of 75 in the United States with a correlation coefficient (R) of -0.062 and weighted average of 8.3%, a difference of 18.5%.
Unemployment Among Seniors over 75 years Correlation Summary
| Measurement | Immigrants from Dominica | Trinidadian and Tobagonian |
| Minimum | 5.3% | 1.0% |
| Maximum | 27.9% | 33.9% |
| Range | 22.7% | 32.9% |
| Mean | 12.7% | 10.9% |
| Median | 11.4% | 9.3% |
| Interquartile 25% (IQ1) | 7.5% | 6.5% |
| Interquartile 75% (IQ3) | 17.1% | 13.0% |
| Interquartile Range (IQR) | 9.6% | 6.5% |
| Standard Deviation (Sample) | 6.6% | 7.4% |
| Standard Deviation (Population) | 6.4% | 7.3% |
Similar Demographics by Unemployment Among Seniors over 75 years
Demographics Similar to Immigrants from Dominica by Unemployment Among Seniors over 75 years
In terms of unemployment among seniors over 75 years, the demographic groups most similar to Immigrants from Dominica are Norwegian (9.8%, a difference of 0.060%), Immigrants from Western Africa (9.8%, a difference of 0.23%), Nonimmigrants (9.8%, a difference of 0.36%), Immigrants from St. Vincent and the Grenadines (9.8%, a difference of 0.41%), and Cherokee (9.8%, a difference of 0.50%).
| Demographics | Rating | Rank | Unemployment Among Seniors over 75 years |
| Danes | 0.0 /100 | #287 | Tragic 9.7% |
| Canadians | 0.0 /100 | #288 | Tragic 9.7% |
| Czechs | 0.0 /100 | #289 | Tragic 9.7% |
| Sioux | 0.0 /100 | #290 | Tragic 9.7% |
| Scandinavians | 0.0 /100 | #291 | Tragic 9.7% |
| Immigrants | Western Africa | 0.0 /100 | #292 | Tragic 9.8% |
| Norwegians | 0.0 /100 | #293 | Tragic 9.8% |
| Immigrants | Dominica | 0.0 /100 | #294 | Tragic 9.8% |
| Immigrants | Nonimmigrants | 0.0 /100 | #295 | Tragic 9.8% |
| Immigrants | St. Vincent and the Grenadines | 0.0 /100 | #296 | Tragic 9.8% |
| Cherokee | 0.0 /100 | #297 | Tragic 9.8% |
| Lithuanians | 0.0 /100 | #298 | Tragic 9.9% |
| Belgians | 0.0 /100 | #299 | Tragic 9.9% |
| Iraqis | 0.0 /100 | #300 | Tragic 9.9% |
| Welsh | 0.0 /100 | #301 | Tragic 10.0% |
Demographics Similar to Trinidadians and Tobagonians by Unemployment Among Seniors over 75 years
In terms of unemployment among seniors over 75 years, the demographic groups most similar to Trinidadians and Tobagonians are Sudanese (8.3%, a difference of 0.12%), Asian (8.3%, a difference of 0.15%), Immigrants from West Indies (8.3%, a difference of 0.19%), Immigrants from India (8.2%, a difference of 0.21%), and French American Indian (8.2%, a difference of 0.33%).
| Demographics | Rating | Rank | Unemployment Among Seniors over 75 years |
| Sri Lankans | 98.9 /100 | #107 | Exceptional 8.2% |
| Laotians | 98.8 /100 | #108 | Exceptional 8.2% |
| Immigrants | Lebanon | 98.8 /100 | #109 | Exceptional 8.2% |
| Marshallese | 98.7 /100 | #110 | Exceptional 8.2% |
| French American Indians | 98.7 /100 | #111 | Exceptional 8.2% |
| Immigrants | India | 98.6 /100 | #112 | Exceptional 8.2% |
| Asians | 98.5 /100 | #113 | Exceptional 8.3% |
| Trinidadians and Tobagonians | 98.4 /100 | #114 | Exceptional 8.3% |
| Sudanese | 98.2 /100 | #115 | Exceptional 8.3% |
| Immigrants | West Indies | 98.1 /100 | #116 | Exceptional 8.3% |
| Immigrants | Greece | 97.9 /100 | #117 | Exceptional 8.3% |
| Immigrants | Middle Africa | 97.9 /100 | #118 | Exceptional 8.3% |
| Japanese | 97.5 /100 | #119 | Exceptional 8.3% |
| Immigrants | Asia | 97.4 /100 | #120 | Exceptional 8.3% |
| Immigrants | Croatia | 97.2 /100 | #121 | Exceptional 8.3% |