Immigrants from Dominica vs Serbian Unemployment Among Ages 45 to 54 years
COMPARE
Immigrants from Dominica
Serbian
Unemployment Among Ages 45 to 54 years
Unemployment Among Ages 45 to 54 years Comparison
Immigrants from Dominica
Serbians
5.6%
UNEMPLOYMENT AMONG AGES 45 TO 54 YEARS
0.0/ 100
METRIC RATING
315th/ 347
METRIC RANK
4.3%
UNEMPLOYMENT AMONG AGES 45 TO 54 YEARS
97.9/ 100
METRIC RATING
79th/ 347
METRIC RANK
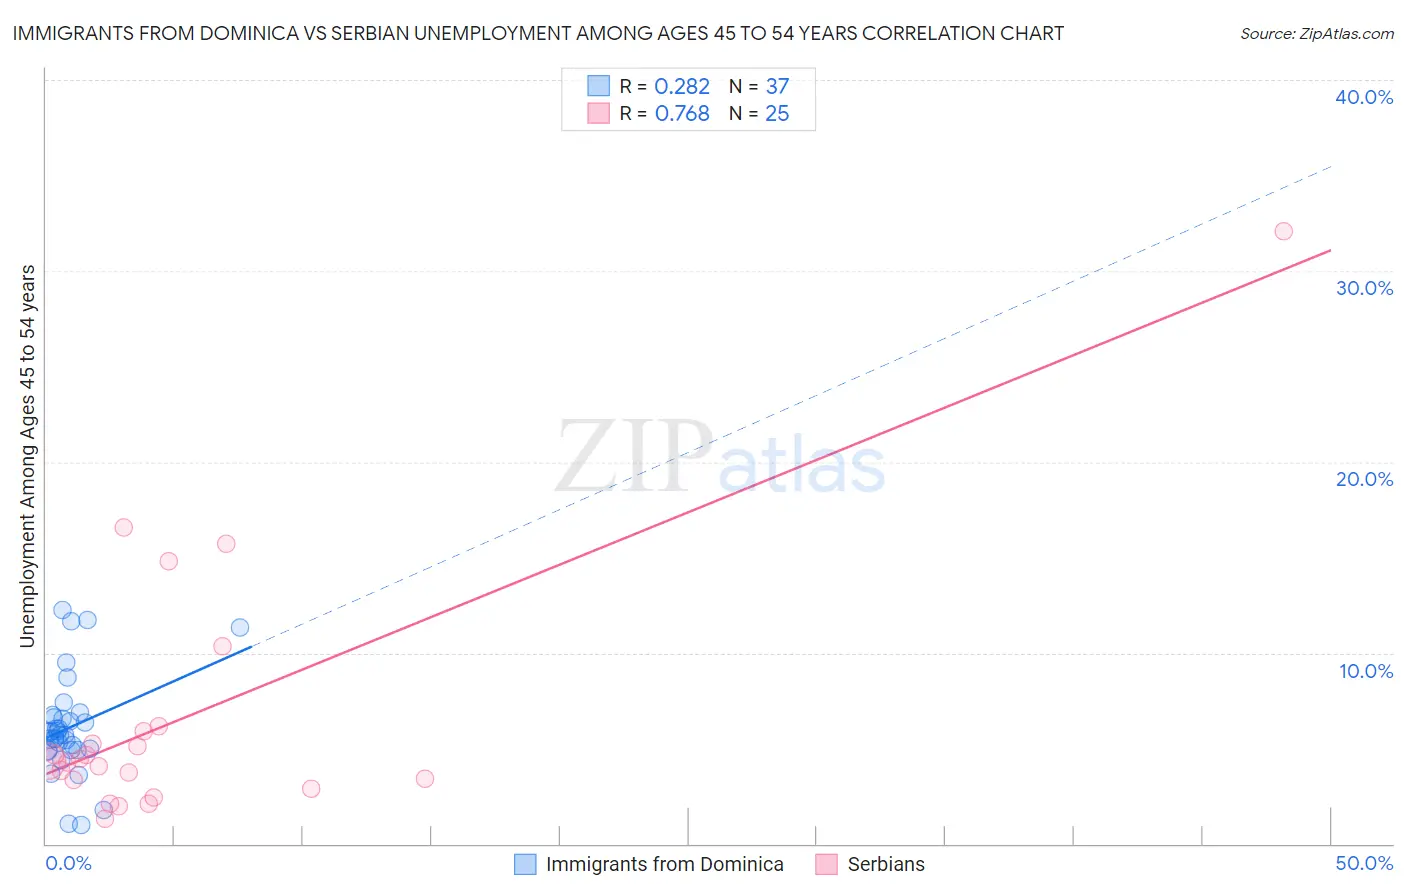
Immigrants from Dominica vs Serbian Unemployment Among Ages 45 to 54 years Correlation Chart
The statistical analysis conducted on geographies consisting of 83,459,757 people shows a weak positive correlation between the proportion of Immigrants from Dominica and unemployment rate among population between the ages 45 and 54 in the United States with a correlation coefficient (R) of 0.282 and weighted average of 5.6%. Similarly, the statistical analysis conducted on geographies consisting of 262,424,593 people shows a strong positive correlation between the proportion of Serbians and unemployment rate among population between the ages 45 and 54 in the United States with a correlation coefficient (R) of 0.768 and weighted average of 4.3%, a difference of 30.0%.
Unemployment Among Ages 45 to 54 years Correlation Summary
| Measurement | Immigrants from Dominica | Serbian |
| Minimum | 1.0% | 1.3% |
| Maximum | 12.3% | 32.1% |
| Range | 11.3% | 30.8% |
| Mean | 6.1% | 6.6% |
| Median | 5.7% | 4.3% |
| Interquartile 25% (IQ1) | 4.9% | 3.1% |
| Interquartile 75% (IQ3) | 6.7% | 6.0% |
| Interquartile Range (IQR) | 1.7% | 2.9% |
| Standard Deviation (Sample) | 2.6% | 6.8% |
| Standard Deviation (Population) | 2.6% | 6.6% |
Similar Demographics by Unemployment Among Ages 45 to 54 years
Demographics Similar to Immigrants from Dominica by Unemployment Among Ages 45 to 54 years
In terms of unemployment among ages 45 to 54 years, the demographic groups most similar to Immigrants from Dominica are Guyanese (5.6%, a difference of 0.18%), Immigrants from Guyana (5.6%, a difference of 0.20%), Houma (5.6%, a difference of 0.30%), Shoshone (5.6%, a difference of 0.51%), and Immigrants from Grenada (5.6%, a difference of 0.55%).
| Demographics | Rating | Rank | Unemployment Among Ages 45 to 54 years |
| Blacks/African Americans | 0.0 /100 | #308 | Tragic 5.4% |
| Barbadians | 0.0 /100 | #309 | Tragic 5.5% |
| Immigrants | Barbados | 0.0 /100 | #310 | Tragic 5.5% |
| Chippewa | 0.0 /100 | #311 | Tragic 5.5% |
| Immigrants | Grenada | 0.0 /100 | #312 | Tragic 5.6% |
| Shoshone | 0.0 /100 | #313 | Tragic 5.6% |
| Guyanese | 0.0 /100 | #314 | Tragic 5.6% |
| Immigrants | Dominica | 0.0 /100 | #315 | Tragic 5.6% |
| Immigrants | Guyana | 0.0 /100 | #316 | Tragic 5.6% |
| Houma | 0.0 /100 | #317 | Tragic 5.6% |
| British West Indians | 0.0 /100 | #318 | Tragic 5.7% |
| Cape Verdeans | 0.0 /100 | #319 | Tragic 5.7% |
| Immigrants | St. Vincent and the Grenadines | 0.0 /100 | #320 | Tragic 5.7% |
| Yakama | 0.0 /100 | #321 | Tragic 5.7% |
| Immigrants | Azores | 0.0 /100 | #322 | Tragic 5.7% |
Demographics Similar to Serbians by Unemployment Among Ages 45 to 54 years
In terms of unemployment among ages 45 to 54 years, the demographic groups most similar to Serbians are German Russian (4.3%, a difference of 0.0%), Cambodian (4.3%, a difference of 0.060%), Chilean (4.3%, a difference of 0.090%), Kenyan (4.3%, a difference of 0.15%), and Slavic (4.3%, a difference of 0.15%).
| Demographics | Rating | Rank | Unemployment Among Ages 45 to 54 years |
| Whites/Caucasians | 98.4 /100 | #72 | Exceptional 4.3% |
| Canadians | 98.2 /100 | #73 | Exceptional 4.3% |
| Immigrants | Belgium | 98.2 /100 | #74 | Exceptional 4.3% |
| Kenyans | 98.1 /100 | #75 | Exceptional 4.3% |
| Slavs | 98.1 /100 | #76 | Exceptional 4.3% |
| Chileans | 98.1 /100 | #77 | Exceptional 4.3% |
| German Russians | 97.9 /100 | #78 | Exceptional 4.3% |
| Serbians | 97.9 /100 | #79 | Exceptional 4.3% |
| Cambodians | 97.8 /100 | #80 | Exceptional 4.3% |
| Immigrants | Micronesia | 97.6 /100 | #81 | Exceptional 4.3% |
| Eastern Europeans | 97.6 /100 | #82 | Exceptional 4.3% |
| Australians | 97.4 /100 | #83 | Exceptional 4.3% |
| Italians | 97.3 /100 | #84 | Exceptional 4.3% |
| French | 97.3 /100 | #85 | Exceptional 4.3% |
| Ethiopians | 97.2 /100 | #86 | Exceptional 4.3% |