Immigrants from Dominica vs Barbadian Unemployment Among Women with Children Ages 6 to 17 years

COMPARE

Immigrants from Dominica
Race
Ancestry
AfghanAfricanAlaska NativeAlaskan AthabascanAlbanianAleutAlsatianAmericanApacheArabArapahoArgentineanArmenianAssyrian/Chaldean/SyriacAustralianAustrianBahamianBangladeshiBasqueBelgianBelizeanBermudanBhutaneseBlackfeetBolivianBrazilianBritishBritish West IndianBulgarianBurmeseCajunCambodianCanadianCape VerdeanCarpatho RusynCelticCentral AmericanCentral American IndianCherokeeCheyenneChickasawChileanChineseChippewaChoctawColombianColvilleComancheCosta RicanCreeCreekCroatianCrowCubanCypriotCzechCzechoslovakianDanishDelawareDominicanDutchDutch West IndianEastern EuropeanEcuadorianEgyptianEnglishEstonianEthiopianEuropeanFijianFilipinoFinnishFrenchFrench American IndianFrench CanadianGermanGerman RussianGhanaianGreekGuamanian/ChamorroGuatemalanGuyaneseHaitianHmongHonduranHopiHoumaHungarianIcelanderIndian (Asian)IndonesianInupiatIranianIraqiIrishIroquoisIsraeliItalianJamaicanJapaneseJordanianKenyanKiowaKoreanLaotianLatvianLebaneseLiberianLithuanianLumbeeLuxembourgerMacedonianMalaysianMalteseMarshalleseMenomineeMexicanMexican American IndianMongolianMoroccanNative HawaiianNavajoNepaleseNew ZealanderNicaraguanNigerianNorthern EuropeanNorwegianOkinawanOsageOttawaPaiutePakistaniPalestinianPanamanianParaguayanPennsylvania GermanPeruvianPimaPolishPortuguesePotawatomiPuebloPuerto RicanPuget Sound SalishRomanianRussianSalvadoranSamoanScandinavianScotch-IrishScottishSeminoleSenegaleseSerbianShoshoneSierra LeoneanSiouxSlavicSlovakSloveneSomaliSouth AfricanSouth AmericanSouth American IndianSoviet UnionSpaniardSpanishSpanish AmericanSpanish American IndianSri LankanSubsaharan AfricanSudaneseSwedishSwissSyrianTaiwaneseThaiTlingit-HaidaTohono O'OdhamTonganTrinidadian and TobagonianTsimshianTurkishU.S. Virgin IslanderUgandanUkrainianUruguayanUteVenezuelanVietnameseWelshWest IndianYakamaYaquiYugoslavianYumanYup'ikZimbabwean
Immigration
NonimmigrantsImmigrantsAfghanistanAfricaAlbaniaArgentinaArmeniaAsiaAustraliaAustriaBahamasBangladeshBarbadosBelarusBelgiumBelizeBoliviaBosnia and HerzegovinaBrazilBulgariaBurma/MyanmarCabo VerdeCambodiaCameroonCanadaCaribbeanCentral AmericaChileChinaColombiaCongoCosta RicaCroatiaCubaCzechoslovakiaDenmarkDominicaDominican RepublicEastern AfricaEastern AsiaEastern EuropeEcuadorEgyptEl SalvadorEnglandEritreaEthiopiaEuropeFijiFranceGermanyGhanaGreeceGrenadaGuatemalaGuyanaHaitiHondurasHong KongHungaryIndiaIndonesiaIranIraqIrelandIsraelItalyJamaicaJapanJordanKazakhstanKenyaKoreaKuwaitLaosLatin AmericaLatviaLebanonLiberiaLithuaniaMalaysiaMexicoMicronesiaMiddle AfricaMoldovaMoroccoNepalNetherlandsNicaraguaNigeriaNorth AmericaNorth MacedoniaNorthern AfricaNorthern EuropeNorwayOceaniaPakistanPanamaPeruPhilippinesPolandPortugalRomaniaRussiaSaudi ArabiaScotlandSenegalSerbiaSierra LeoneSingaporeSomaliaSouth AfricaSouth AmericaSouth Central AsiaSouth Eastern AsiaSouthern EuropeSpainSri LankaSt. Vincent and the GrenadinesSudanSwedenSwitzerlandSyriaTaiwanThailandTrinidad and TobagoTurkeyUgandaUkraineUruguayUzbekistanVenezuelaVietnamWest IndiesWestern AfricaWestern AsiaWestern EuropeYemenZaireZimbabweAzores
Barbadian
Race
Ancestry
AfghanAfricanAlaska NativeAlaskan AthabascanAlbanianAleutAlsatianAmericanApacheArabArapahoArgentineanArmenianAssyrian/Chaldean/SyriacAustralianAustrianBahamianBangladeshiBarbadianBasqueBelgianBelizeanBermudanBhutaneseBlackfeetBolivianBrazilianBritishBritish West IndianBulgarianBurmeseCajunCambodianCanadianCape VerdeanCarpatho RusynCelticCentral AmericanCentral American IndianCherokeeCheyenneChickasawChileanChineseChippewaChoctawColombianColvilleComancheCosta RicanCreeCreekCroatianCrowCubanCypriotCzechCzechoslovakianDanishDelawareDominicanDutchDutch West IndianEastern EuropeanEcuadorianEgyptianEnglishEstonianEthiopianEuropeanFijianFilipinoFinnishFrenchFrench American IndianFrench CanadianGermanGerman RussianGhanaianGreekGuamanian/ChamorroGuatemalanGuyaneseHaitianHmongHonduranHopiHoumaHungarianIcelanderIndian (Asian)IndonesianInupiatIranianIraqiIrishIroquoisIsraeliItalianJamaicanJapaneseJordanianKenyanKiowaKoreanLaotianLatvianLebaneseLiberianLithuanianLumbeeLuxembourgerMacedonianMalaysianMalteseMarshalleseMenomineeMexicanMexican American IndianMongolianMoroccanNative HawaiianNavajoNepaleseNew ZealanderNicaraguanNigerianNorthern EuropeanNorwegianOkinawanOsageOttawaPaiutePakistaniPalestinianPanamanianParaguayanPennsylvania GermanPeruvianPimaPolishPortuguesePotawatomiPuebloPuerto RicanPuget Sound SalishRomanianRussianSalvadoranSamoanScandinavianScotch-IrishScottishSeminoleSenegaleseSerbianShoshoneSierra LeoneanSiouxSlavicSlovakSloveneSomaliSouth AfricanSouth AmericanSouth American IndianSoviet UnionSpaniardSpanishSpanish AmericanSpanish American IndianSri LankanSubsaharan AfricanSudaneseSwedishSwissSyrianTaiwaneseThaiTlingit-HaidaTohono O'OdhamTonganTrinidadian and TobagonianTsimshianTurkishU.S. Virgin IslanderUgandanUkrainianUruguayanUteVenezuelanVietnameseWelshWest IndianYakamaYaquiYugoslavianYumanYup'ikZimbabwean
Immigration
NonimmigrantsImmigrantsAfghanistanAfricaAlbaniaArgentinaArmeniaAsiaAustraliaAustriaBahamasBangladeshBarbadosBelarusBelgiumBelizeBoliviaBosnia and HerzegovinaBrazilBulgariaBurma/MyanmarCabo VerdeCambodiaCameroonCanadaCaribbeanCentral AmericaChileChinaColombiaCongoCosta RicaCroatiaCubaCzechoslovakiaDenmarkDominican RepublicEastern AfricaEastern AsiaEastern EuropeEcuadorEgyptEl SalvadorEnglandEritreaEthiopiaEuropeFijiFranceGermanyGhanaGreeceGrenadaGuatemalaGuyanaHaitiHondurasHong KongHungaryIndiaIndonesiaIranIraqIrelandIsraelItalyJamaicaJapanJordanKazakhstanKenyaKoreaKuwaitLaosLatin AmericaLatviaLebanonLiberiaLithuaniaMalaysiaMexicoMicronesiaMiddle AfricaMoldovaMoroccoNepalNetherlandsNicaraguaNigeriaNorth AmericaNorth MacedoniaNorthern AfricaNorthern EuropeNorwayOceaniaPakistanPanamaPeruPhilippinesPolandPortugalRomaniaRussiaSaudi ArabiaScotlandSenegalSerbiaSierra LeoneSingaporeSomaliaSouth AfricaSouth AmericaSouth Central AsiaSouth Eastern AsiaSouthern EuropeSpainSri LankaSt. Vincent and the GrenadinesSudanSwedenSwitzerlandSyriaTaiwanThailandTrinidad and TobagoTurkeyUgandaUkraineUruguayUzbekistanVenezuelaVietnamWest IndiesWestern AfricaWestern AsiaWestern EuropeYemenZaireZimbabweAzores
Unemployment Among Women with Children Ages 6 to 17 years
Income
Poverty
Unemployment
Labor Participation
Family Structure
Vehicle Availability
Education Level
Disability

Unemployment Among Women with Children Ages 6 to 17 years Comparison

Immigrants from Dominica

Barbadians

Tragic
Exceptional
10.5%
UNEMPLOYMENT AMONG WOMEN WITH CHILDREN AGES 6 TO 17 YEARS
0.0/ 100
METRIC RATING
316th/ 347
METRIC RANK
8.7%
UNEMPLOYMENT AMONG WOMEN WITH CHILDREN AGES 6 TO 17 YEARS
93.8/ 100
METRIC RATING
129th/ 347
METRIC RANK

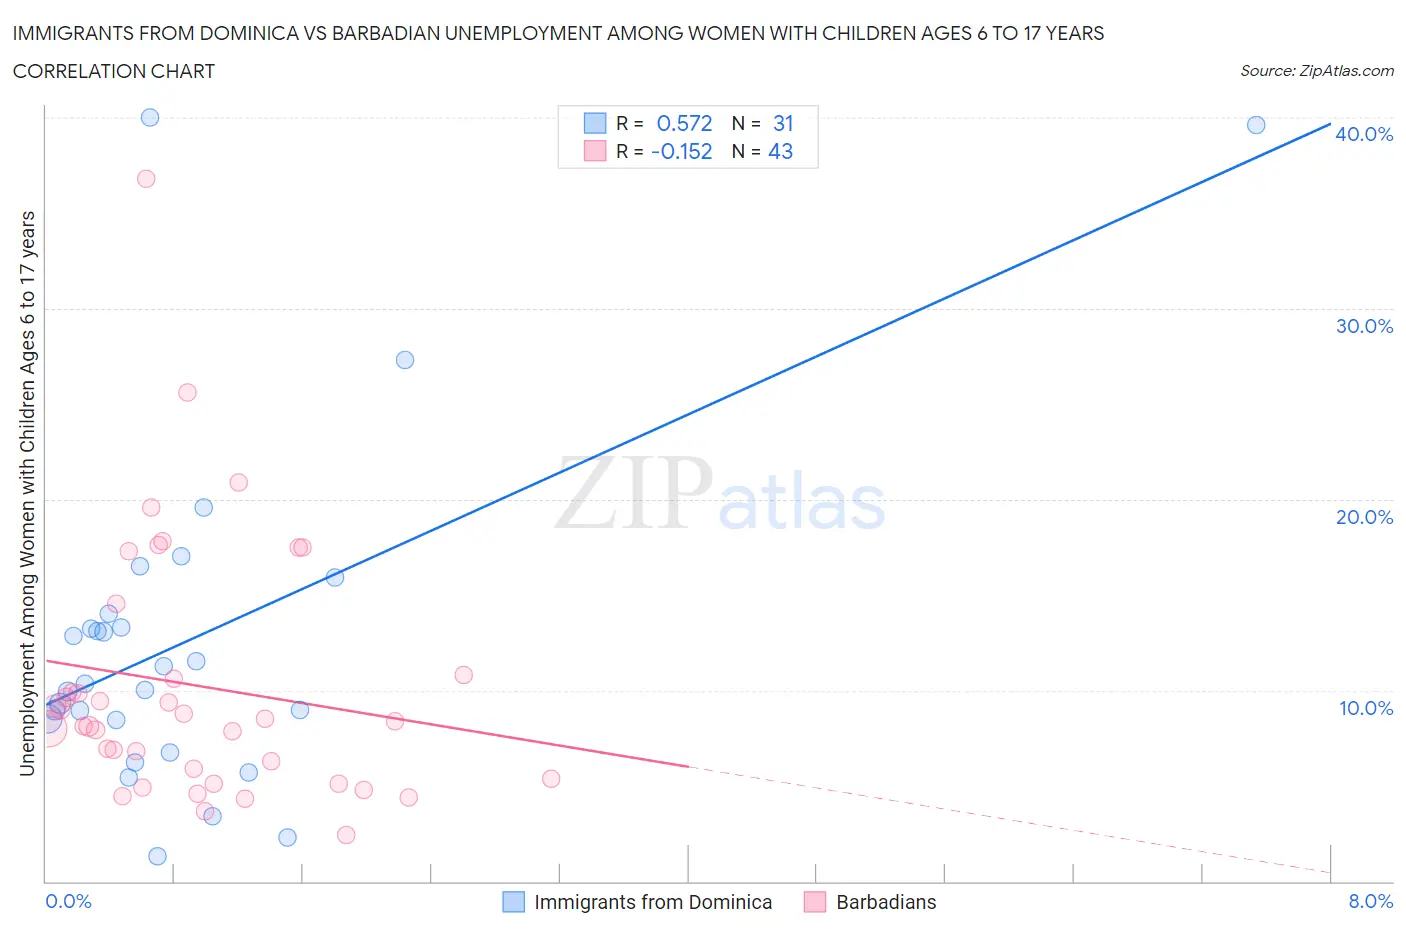
Immigrants from Dominica vs Barbadian Unemployment Among Women with Children Ages 6 to 17 years Correlation Chart

The statistical analysis conducted on geographies consisting of 74,932,264 people shows a substantial positive correlation between the proportion of Immigrants from Dominica and unemployment rate among women with children between the ages 6 and 17 in the United States with a correlation coefficient (R) of 0.572 and weighted average of 10.5%. Similarly, the statistical analysis conducted on geographies consisting of 121,323,299 people shows a poor negative correlation between the proportion of Barbadians and unemployment rate among women with children between the ages 6 and 17 in the United States with a correlation coefficient (R) of -0.152 and weighted average of 8.7%, a difference of 20.8%.
Immigrants from Dominica vs Barbadian Unemployment Among Women with Children Ages 6 to 17 years

Unemployment Among Women with Children Ages 6 to 17 years Correlation Summary

MeasurementImmigrants from DominicaBarbadian
Minimum1.3%2.4%
Maximum40.0%36.8%
Range38.7%34.4%
Mean12.7%10.2%
Median10.3%8.4%
Interquartile 25% (IQ1)8.5%5.4%
Interquartile 75% (IQ3)14.0%10.8%
Interquartile Range (IQR)5.5%5.4%
Standard Deviation (Sample)8.9%6.7%
Standard Deviation (Population)8.8%6.7%

Similar Demographics by Unemployment Among Women with Children Ages 6 to 17 years

Demographics Similar to Immigrants from Dominica by Unemployment Among Women with Children Ages 6 to 17 years

In terms of unemployment among women with children ages 6 to 17 years, the demographic groups most similar to Immigrants from Dominica are Bermudan (10.5%, a difference of 0.12%), Delaware (10.5%, a difference of 0.13%), Bahamian (10.4%, a difference of 0.75%), Immigrants from Cabo Verde (10.4%, a difference of 0.78%), and American (10.4%, a difference of 0.83%).
DemographicsRating | RankUnemployment Among Women with Children Ages 6 to 17 years
French Canadians
0.0
/100
|
#309
Tragic
10.3%
Alaska Natives
0.0
/100
|
#310
Tragic
10.3%
Immigrants | Liberia
0.0
/100
|
#311
Tragic
10.3%
Africans
0.0
/100
|
#312
Tragic
10.4%
Americans
0.0
/100
|
#313
Tragic
10.4%
Immigrants | Cabo Verde
0.0
/100
|
#314
Tragic
10.4%
Bahamians
0.0
/100
|
#315
Tragic
10.4%
Immigrants | Dominica
0.0
/100
|
#316
Tragic
10.5%
Bermudans
0.0
/100
|
#317
Tragic
10.5%
Delaware
0.0
/100
|
#318
Tragic
10.5%
Immigrants | Uganda
0.0
/100
|
#319
Tragic
10.7%
Apache
0.0
/100
|
#320
Tragic
10.7%
Tohono O'odham
0.0
/100
|
#321
Tragic
10.7%
Cree
0.0
/100
|
#322
Tragic
10.8%
Dominicans
0.0
/100
|
#323
Tragic
10.8%

Demographics Similar to Barbadians by Unemployment Among Women with Children Ages 6 to 17 years

In terms of unemployment among women with children ages 6 to 17 years, the demographic groups most similar to Barbadians are Hmong (8.7%, a difference of 0.10%), Immigrants from Northern Africa (8.7%, a difference of 0.12%), Czech (8.7%, a difference of 0.12%), Immigrants from Western Asia (8.7%, a difference of 0.14%), and South African (8.7%, a difference of 0.15%).
DemographicsRating | RankUnemployment Among Women with Children Ages 6 to 17 years
Immigrants | Egypt
95.0
/100
|
#122
Exceptional
8.7%
Immigrants | Morocco
94.9
/100
|
#123
Exceptional
8.7%
Immigrants | Lebanon
94.9
/100
|
#124
Exceptional
8.7%
South Africans
94.6
/100
|
#125
Exceptional
8.7%
Immigrants | Northern Africa
94.4
/100
|
#126
Exceptional
8.7%
Czechs
94.4
/100
|
#127
Exceptional
8.7%
Hmong
94.3
/100
|
#128
Exceptional
8.7%
Barbadians
93.8
/100
|
#129
Exceptional
8.7%
Immigrants | Western Asia
93.1
/100
|
#130
Exceptional
8.7%
Slavs
92.2
/100
|
#131
Exceptional
8.7%
Yaqui
92.2
/100
|
#132
Exceptional
8.7%
Egyptians
91.8
/100
|
#133
Exceptional
8.7%
Immigrants | Ireland
91.0
/100
|
#134
Exceptional
8.7%
Europeans
90.6
/100
|
#135
Exceptional
8.7%
Immigrants | Latvia
90.4
/100
|
#136
Exceptional
8.7%