Immigrants from Denmark vs Guamanian/Chamorro Unemployment Among Women with Children Under 6 years
COMPARE
Immigrants from Denmark
Guamanian/Chamorro
Unemployment Among Women with Children Under 6 years
Unemployment Among Women with Children Under 6 years Comparison
Immigrants from Denmark
Guamanians/Chamorros
7.1%
UNEMPLOYMENT AMONG WOMEN WITH CHILDREN UNDER 6 YEARS
98.3/ 100
METRIC RATING
89th/ 347
METRIC RANK
7.8%
UNEMPLOYMENT AMONG WOMEN WITH CHILDREN UNDER 6 YEARS
25.5/ 100
METRIC RATING
200th/ 347
METRIC RANK
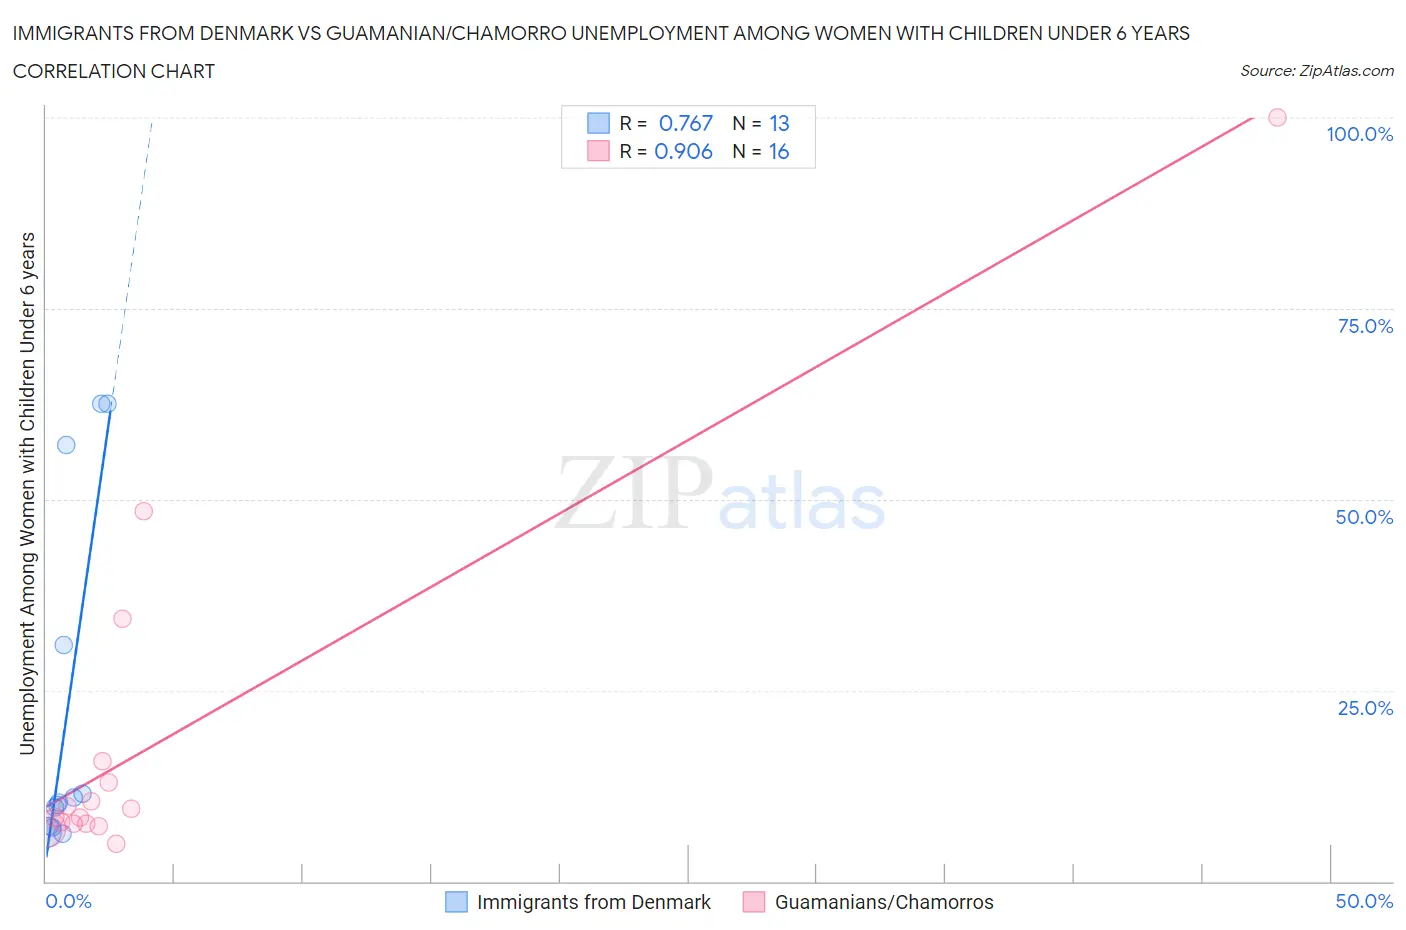
Immigrants from Denmark vs Guamanian/Chamorro Unemployment Among Women with Children Under 6 years Correlation Chart
The statistical analysis conducted on geographies consisting of 117,608,008 people shows a strong positive correlation between the proportion of Immigrants from Denmark and unemployment rate among women with children under the age of 6 in the United States with a correlation coefficient (R) of 0.767 and weighted average of 7.1%. Similarly, the statistical analysis conducted on geographies consisting of 190,704,537 people shows a near-perfect positive correlation between the proportion of Guamanians/Chamorros and unemployment rate among women with children under the age of 6 in the United States with a correlation coefficient (R) of 0.906 and weighted average of 7.8%, a difference of 9.1%.
Unemployment Among Women with Children Under 6 years Correlation Summary
| Measurement | Immigrants from Denmark | Guamanian/Chamorro |
| Minimum | 6.3% | 4.9% |
| Maximum | 62.5% | 100.0% |
| Range | 56.2% | 95.1% |
| Mean | 22.5% | 18.8% |
| Median | 10.3% | 9.0% |
| Interquartile 25% (IQ1) | 7.2% | 7.6% |
| Interquartile 75% (IQ3) | 44.0% | 14.4% |
| Interquartile Range (IQR) | 36.8% | 6.8% |
| Standard Deviation (Sample) | 22.7% | 24.6% |
| Standard Deviation (Population) | 21.8% | 23.8% |
Similar Demographics by Unemployment Among Women with Children Under 6 years
Demographics Similar to Immigrants from Denmark by Unemployment Among Women with Children Under 6 years
In terms of unemployment among women with children under 6 years, the demographic groups most similar to Immigrants from Denmark are Immigrants from Hungary (7.1%, a difference of 0.040%), Immigrants from Spain (7.1%, a difference of 0.050%), Danish (7.1%, a difference of 0.12%), Alsatian (7.1%, a difference of 0.16%), and Albanian (7.2%, a difference of 0.25%).
| Demographics | Rating | Rank | Unemployment Among Women with Children Under 6 years |
| Immigrants | Afghanistan | 98.7 /100 | #82 | Exceptional 7.1% |
| Egyptians | 98.7 /100 | #83 | Exceptional 7.1% |
| Immigrants | Albania | 98.7 /100 | #84 | Exceptional 7.1% |
| Immigrants | Romania | 98.7 /100 | #85 | Exceptional 7.1% |
| Immigrants | Zimbabwe | 98.6 /100 | #86 | Exceptional 7.1% |
| Alsatians | 98.4 /100 | #87 | Exceptional 7.1% |
| Immigrants | Hungary | 98.3 /100 | #88 | Exceptional 7.1% |
| Immigrants | Denmark | 98.3 /100 | #89 | Exceptional 7.1% |
| Immigrants | Spain | 98.2 /100 | #90 | Exceptional 7.1% |
| Danes | 98.2 /100 | #91 | Exceptional 7.1% |
| Albanians | 98.0 /100 | #92 | Exceptional 7.2% |
| New Zealanders | 97.8 /100 | #93 | Exceptional 7.2% |
| Macedonians | 97.7 /100 | #94 | Exceptional 7.2% |
| Romanians | 97.7 /100 | #95 | Exceptional 7.2% |
| Immigrants | Eastern Africa | 97.7 /100 | #96 | Exceptional 7.2% |
Demographics Similar to Guamanians/Chamorros by Unemployment Among Women with Children Under 6 years
In terms of unemployment among women with children under 6 years, the demographic groups most similar to Guamanians/Chamorros are Basque (7.8%, a difference of 0.070%), Immigrants from Poland (7.8%, a difference of 0.15%), Sudanese (7.8%, a difference of 0.18%), Spaniard (7.8%, a difference of 0.19%), and Lebanese (7.8%, a difference of 0.30%).
| Demographics | Rating | Rank | Unemployment Among Women with Children Under 6 years |
| Slavs | 32.4 /100 | #193 | Fair 7.7% |
| Syrians | 31.9 /100 | #194 | Fair 7.7% |
| Malaysians | 31.1 /100 | #195 | Fair 7.7% |
| Immigrants | St. Vincent and the Grenadines | 31.1 /100 | #196 | Fair 7.7% |
| Italians | 30.4 /100 | #197 | Fair 7.7% |
| Lithuanians | 30.0 /100 | #198 | Fair 7.8% |
| Immigrants | Poland | 27.3 /100 | #199 | Fair 7.8% |
| Guamanians/Chamorros | 25.5 /100 | #200 | Fair 7.8% |
| Basques | 24.7 /100 | #201 | Fair 7.8% |
| Sudanese | 23.5 /100 | #202 | Fair 7.8% |
| Spaniards | 23.3 /100 | #203 | Fair 7.8% |
| Lebanese | 22.2 /100 | #204 | Fair 7.8% |
| Immigrants | Immigrants | 21.4 /100 | #205 | Fair 7.8% |
| Hungarians | 21.2 /100 | #206 | Fair 7.8% |
| Canadians | 20.6 /100 | #207 | Fair 7.8% |