Immigrants from Denmark vs Bolivian Unemployment Among Ages 35 to 44 years

COMPARE

Immigrants from Denmark
Race
Ancestry
AfghanAfricanAlaska NativeAlaskan AthabascanAlbanianAleutAlsatianAmericanApacheArabArapahoArgentineanArmenianAssyrian/Chaldean/SyriacAustralianAustrianBahamianBangladeshiBarbadianBasqueBelgianBelizeanBermudanBhutaneseBlackfeetBrazilianBritishBritish West IndianBulgarianBurmeseCajunCambodianCanadianCape VerdeanCarpatho RusynCelticCentral AmericanCentral American IndianCherokeeCheyenneChickasawChileanChineseChippewaChoctawColombianColvilleComancheCosta RicanCreeCreekCroatianCrowCubanCypriotCzechCzechoslovakianDanishDelawareDominicanDutchDutch West IndianEastern EuropeanEcuadorianEgyptianEnglishEstonianEthiopianEuropeanFijianFilipinoFinnishFrenchFrench American IndianFrench CanadianGermanGerman RussianGhanaianGreekGuamanian/ChamorroGuatemalanGuyaneseHaitianHmongHonduranHopiHoumaHungarianIcelanderIndian (Asian)IndonesianInupiatIranianIraqiIrishIroquoisIsraeliItalianJamaicanJapaneseJordanianKenyanKiowaKoreanLaotianLatvianLebaneseLiberianLithuanianLumbeeLuxembourgerMacedonianMalaysianMalteseMarshalleseMenomineeMexicanMexican American IndianMongolianMoroccanNative HawaiianNavajoNepaleseNew ZealanderNicaraguanNigerianNorthern EuropeanNorwegianOkinawanOsageOttawaPaiutePakistaniPalestinianPanamanianParaguayanPennsylvania GermanPeruvianPimaPolishPortuguesePotawatomiPuebloPuerto RicanPuget Sound SalishRomanianRussianSalvadoranSamoanScandinavianScotch-IrishScottishSeminoleSenegaleseSerbianShoshoneSierra LeoneanSiouxSlavicSlovakSloveneSomaliSouth AfricanSouth AmericanSouth American IndianSoviet UnionSpaniardSpanishSpanish AmericanSpanish American IndianSri LankanSubsaharan AfricanSudaneseSwedishSwissSyrianTaiwaneseThaiTlingit-HaidaTohono O'OdhamTonganTrinidadian and TobagonianTsimshianTurkishU.S. Virgin IslanderUgandanUkrainianUruguayanUteVenezuelanVietnameseWelshWest IndianYakamaYaquiYugoslavianYumanYup'ikZimbabwean
Immigration
NonimmigrantsImmigrantsAfghanistanAfricaAlbaniaArgentinaArmeniaAsiaAustraliaAustriaBahamasBangladeshBarbadosBelarusBelgiumBelizeBoliviaBosnia and HerzegovinaBrazilBulgariaBurma/MyanmarCabo VerdeCambodiaCameroonCanadaCaribbeanCentral AmericaChileChinaColombiaCongoCosta RicaCroatiaCubaCzechoslovakiaDenmarkDominicaDominican RepublicEastern AfricaEastern AsiaEastern EuropeEcuadorEgyptEl SalvadorEnglandEritreaEthiopiaEuropeFijiFranceGermanyGhanaGreeceGrenadaGuatemalaGuyanaHaitiHondurasHong KongHungaryIndiaIndonesiaIranIraqIrelandIsraelItalyJamaicaJapanJordanKazakhstanKenyaKoreaKuwaitLaosLatin AmericaLatviaLebanonLiberiaLithuaniaMalaysiaMexicoMicronesiaMiddle AfricaMoldovaMoroccoNepalNetherlandsNicaraguaNigeriaNorth AmericaNorth MacedoniaNorthern AfricaNorthern EuropeNorwayOceaniaPakistanPanamaPeruPhilippinesPolandPortugalRomaniaRussiaSaudi ArabiaScotlandSenegalSerbiaSierra LeoneSingaporeSomaliaSouth AfricaSouth AmericaSouth Central AsiaSouth Eastern AsiaSouthern EuropeSpainSri LankaSt. Vincent and the GrenadinesSudanSwedenSwitzerlandSyriaTaiwanThailandTrinidad and TobagoTurkeyUgandaUkraineUruguayUzbekistanVenezuelaVietnamWest IndiesWestern AfricaWestern AsiaWestern EuropeYemenZaireZimbabweAzores
Bolivian
Race
Ancestry
AfghanAfricanAlaska NativeAlaskan AthabascanAlbanianAleutAlsatianAmericanApacheArabArapahoArgentineanArmenianAssyrian/Chaldean/SyriacAustralianAustrianBahamianBangladeshiBarbadianBasqueBelgianBelizeanBermudanBhutaneseBlackfeetBolivianBrazilianBritishBritish West IndianBulgarianBurmeseCajunCambodianCanadianCape VerdeanCarpatho RusynCelticCentral AmericanCentral American IndianCherokeeCheyenneChickasawChileanChineseChippewaChoctawColombianColvilleComancheCosta RicanCreeCreekCroatianCrowCubanCypriotCzechCzechoslovakianDanishDelawareDominicanDutchDutch West IndianEastern EuropeanEcuadorianEgyptianEnglishEstonianEthiopianEuropeanFijianFilipinoFinnishFrenchFrench American IndianFrench CanadianGermanGerman RussianGhanaianGreekGuamanian/ChamorroGuatemalanGuyaneseHaitianHmongHonduranHopiHoumaHungarianIcelanderIndian (Asian)IndonesianInupiatIranianIraqiIrishIroquoisIsraeliItalianJamaicanJapaneseJordanianKenyanKiowaKoreanLaotianLatvianLebaneseLiberianLithuanianLumbeeLuxembourgerMacedonianMalaysianMalteseMarshalleseMenomineeMexicanMexican American IndianMongolianMoroccanNative HawaiianNavajoNepaleseNew ZealanderNicaraguanNigerianNorthern EuropeanNorwegianOkinawanOsageOttawaPaiutePakistaniPalestinianPanamanianParaguayanPennsylvania GermanPeruvianPimaPolishPortuguesePotawatomiPuebloPuerto RicanPuget Sound SalishRomanianRussianSalvadoranSamoanScandinavianScotch-IrishScottishSeminoleSenegaleseSerbianShoshoneSierra LeoneanSiouxSlavicSlovakSloveneSomaliSouth AfricanSouth AmericanSouth American IndianSoviet UnionSpaniardSpanishSpanish AmericanSpanish American IndianSri LankanSubsaharan AfricanSudaneseSwedishSwissSyrianTaiwaneseThaiTlingit-HaidaTohono O'OdhamTonganTrinidadian and TobagonianTsimshianTurkishU.S. Virgin IslanderUgandanUkrainianUruguayanUteVenezuelanVietnameseWelshWest IndianYakamaYaquiYugoslavianYumanYup'ikZimbabwean
Immigration
NonimmigrantsImmigrantsAfghanistanAfricaAlbaniaArgentinaArmeniaAsiaAustraliaAustriaBahamasBangladeshBarbadosBelarusBelgiumBelizeBoliviaBosnia and HerzegovinaBrazilBulgariaBurma/MyanmarCabo VerdeCambodiaCameroonCanadaCaribbeanCentral AmericaChileChinaColombiaCongoCosta RicaCroatiaCubaCzechoslovakiaDominicaDominican RepublicEastern AfricaEastern AsiaEastern EuropeEcuadorEgyptEl SalvadorEnglandEritreaEthiopiaEuropeFijiFranceGermanyGhanaGreeceGrenadaGuatemalaGuyanaHaitiHondurasHong KongHungaryIndiaIndonesiaIranIraqIrelandIsraelItalyJamaicaJapanJordanKazakhstanKenyaKoreaKuwaitLaosLatin AmericaLatviaLebanonLiberiaLithuaniaMalaysiaMexicoMicronesiaMiddle AfricaMoldovaMoroccoNepalNetherlandsNicaraguaNigeriaNorth AmericaNorth MacedoniaNorthern AfricaNorthern EuropeNorwayOceaniaPakistanPanamaPeruPhilippinesPolandPortugalRomaniaRussiaSaudi ArabiaScotlandSenegalSerbiaSierra LeoneSingaporeSomaliaSouth AfricaSouth AmericaSouth Central AsiaSouth Eastern AsiaSouthern EuropeSpainSri LankaSt. Vincent and the GrenadinesSudanSwedenSwitzerlandSyriaTaiwanThailandTrinidad and TobagoTurkeyUgandaUkraineUruguayUzbekistanVenezuelaVietnamWest IndiesWestern AfricaWestern AsiaWestern EuropeYemenZaireZimbabweAzores
Unemployment Among Ages 35 to 44 years
Income
Poverty
Unemployment
Labor Participation
Family Structure
Vehicle Availability
Education Level
Disability

Unemployment Among Ages 35 to 44 years Comparison

Immigrants from Denmark

Bolivians

Good
Exceptional
4.6%
UNEMPLOYMENT AMONG AGES 35 TO 44 YEARS
74.4/ 100
METRIC RATING
146th/ 347
METRIC RANK
4.1%
UNEMPLOYMENT AMONG AGES 35 TO 44 YEARS
99.9/ 100
METRIC RATING
13th/ 347
METRIC RANK

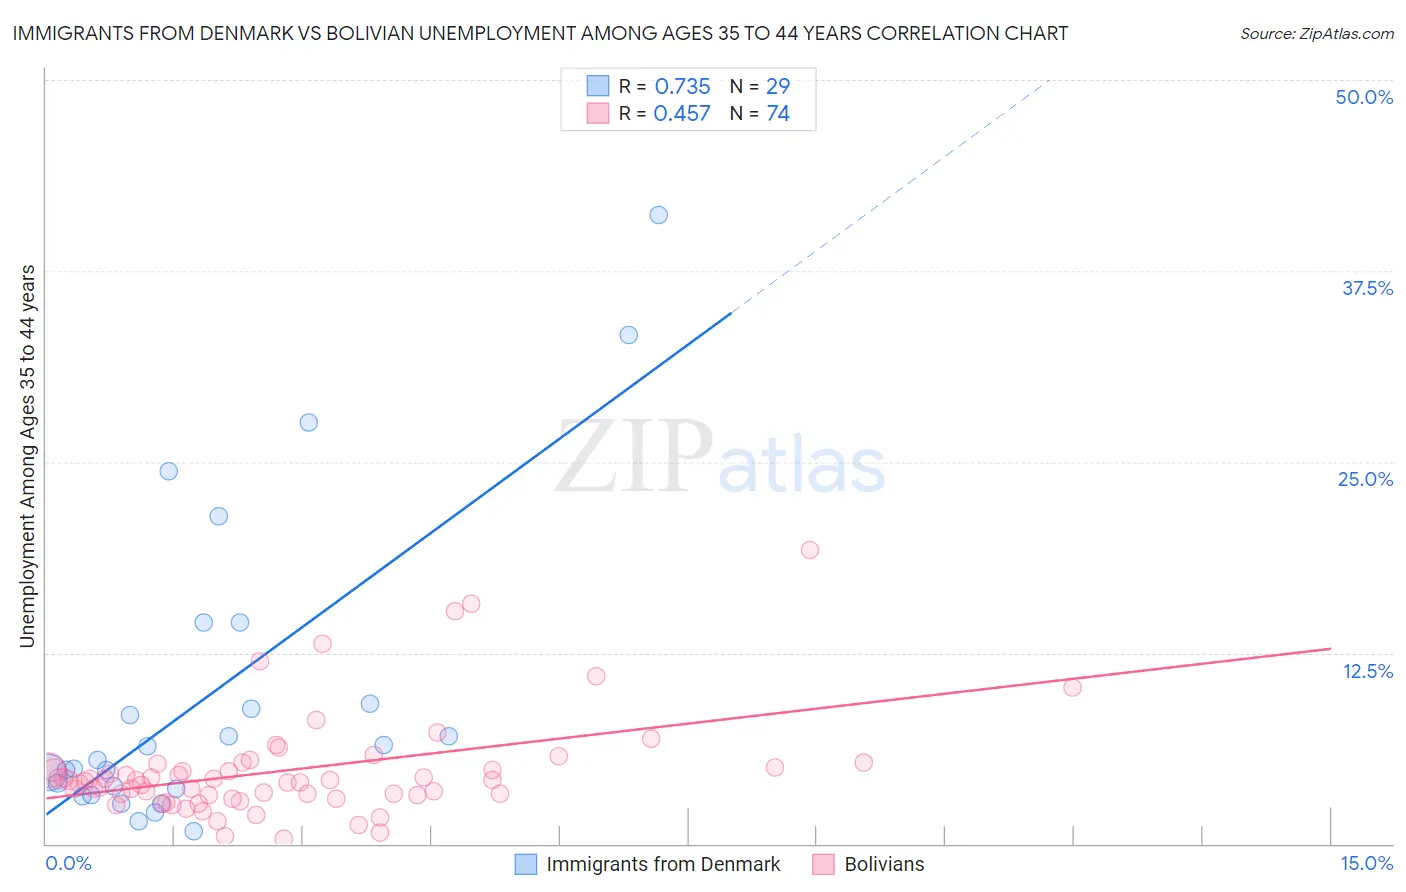
Immigrants from Denmark vs Bolivian Unemployment Among Ages 35 to 44 years Correlation Chart

The statistical analysis conducted on geographies consisting of 134,898,845 people shows a strong positive correlation between the proportion of Immigrants from Denmark and unemployment rate among population between the ages 35 and 44 in the United States with a correlation coefficient (R) of 0.735 and weighted average of 4.6%. Similarly, the statistical analysis conducted on geographies consisting of 183,041,797 people shows a moderate positive correlation between the proportion of Bolivians and unemployment rate among population between the ages 35 and 44 in the United States with a correlation coefficient (R) of 0.457 and weighted average of 4.1%, a difference of 11.1%.
Immigrants from Denmark vs Bolivian Unemployment Among Ages 35 to 44 years

Unemployment Among Ages 35 to 44 years Correlation Summary

MeasurementImmigrants from DenmarkBolivian
Minimum0.80%0.30%
Maximum41.2%19.2%
Range40.4%18.9%
Mean9.7%4.8%
Median5.5%4.2%
Interquartile 25% (IQ1)3.4%3.2%
Interquartile 75% (IQ3)11.8%5.0%
Interquartile Range (IQR)8.4%1.8%
Standard Deviation (Sample)10.2%3.4%
Standard Deviation (Population)10.0%3.4%

Similar Demographics by Unemployment Among Ages 35 to 44 years

Demographics Similar to Immigrants from Denmark by Unemployment Among Ages 35 to 44 years

In terms of unemployment among ages 35 to 44 years, the demographic groups most similar to Immigrants from Denmark are Immigrants from Eastern Europe (4.6%, a difference of 0.020%), Immigrants from Vietnam (4.6%, a difference of 0.060%), Immigrants from Switzerland (4.6%, a difference of 0.10%), Immigrants from Russia (4.6%, a difference of 0.10%), and Ukrainian (4.6%, a difference of 0.13%).
DemographicsRating | RankUnemployment Among Ages 35 to 44 years
Immigrants | Hungary
76.3
/100
|
#139
Good
4.6%
Immigrants | Eastern Africa
76.0
/100
|
#140
Good
4.6%
Canadians
75.9
/100
|
#141
Good
4.6%
Ukrainians
75.8
/100
|
#142
Good
4.6%
Immigrants | Switzerland
75.5
/100
|
#143
Good
4.6%
Immigrants | Russia
75.4
/100
|
#144
Good
4.6%
Immigrants | Eastern Europe
74.7
/100
|
#145
Good
4.6%
Immigrants | Denmark
74.4
/100
|
#146
Good
4.6%
Immigrants | Vietnam
73.8
/100
|
#147
Good
4.6%
Slavs
72.4
/100
|
#148
Good
4.6%
Immigrants | Burma/Myanmar
72.2
/100
|
#149
Good
4.6%
Immigrants | England
70.5
/100
|
#150
Good
4.6%
Puget Sound Salish
67.1
/100
|
#151
Good
4.6%
Pakistanis
67.1
/100
|
#152
Good
4.6%
Immigrants | Brazil
67.0
/100
|
#153
Good
4.6%

Demographics Similar to Bolivians by Unemployment Among Ages 35 to 44 years

In terms of unemployment among ages 35 to 44 years, the demographic groups most similar to Bolivians are Venezuelan (4.1%, a difference of 0.040%), Czech (4.1%, a difference of 0.10%), Sudanese (4.1%, a difference of 0.14%), Tongan (4.2%, a difference of 0.18%), and Immigrants from Singapore (4.1%, a difference of 0.21%).
DemographicsRating | RankUnemployment Among Ages 35 to 44 years
Immigrants | Venezuela
100.0
/100
|
#6
Exceptional
4.0%
Immigrants | Cuba
99.9
/100
|
#7
Exceptional
4.1%
Immigrants | South Central Asia
99.9
/100
|
#8
Exceptional
4.1%
Danes
99.9
/100
|
#9
Exceptional
4.1%
Immigrants | Singapore
99.9
/100
|
#10
Exceptional
4.1%
Sudanese
99.9
/100
|
#11
Exceptional
4.1%
Venezuelans
99.9
/100
|
#12
Exceptional
4.1%
Bolivians
99.9
/100
|
#13
Exceptional
4.1%
Czechs
99.9
/100
|
#14
Exceptional
4.1%
Tongans
99.8
/100
|
#15
Exceptional
4.2%
Cubans
99.8
/100
|
#16
Exceptional
4.2%
Swedes
99.8
/100
|
#17
Exceptional
4.2%
Latvians
99.8
/100
|
#18
Exceptional
4.2%
Immigrants | Nepal
99.7
/100
|
#19
Exceptional
4.2%
Immigrants | Bolivia
99.7
/100
|
#20
Exceptional
4.2%