Immigrants from Czechoslovakia vs Comanche Unemployment Among Women with Children Under 6 years
COMPARE
Immigrants from Czechoslovakia
Comanche
Unemployment Among Women with Children Under 6 years
Unemployment Among Women with Children Under 6 years Comparison
Immigrants from Czechoslovakia
Comanche
7.0%
UNEMPLOYMENT AMONG WOMEN WITH CHILDREN UNDER 6 YEARS
99.2/ 100
METRIC RATING
73rd/ 347
METRIC RANK
8.0%
UNEMPLOYMENT AMONG WOMEN WITH CHILDREN UNDER 6 YEARS
4.3/ 100
METRIC RATING
235th/ 347
METRIC RANK
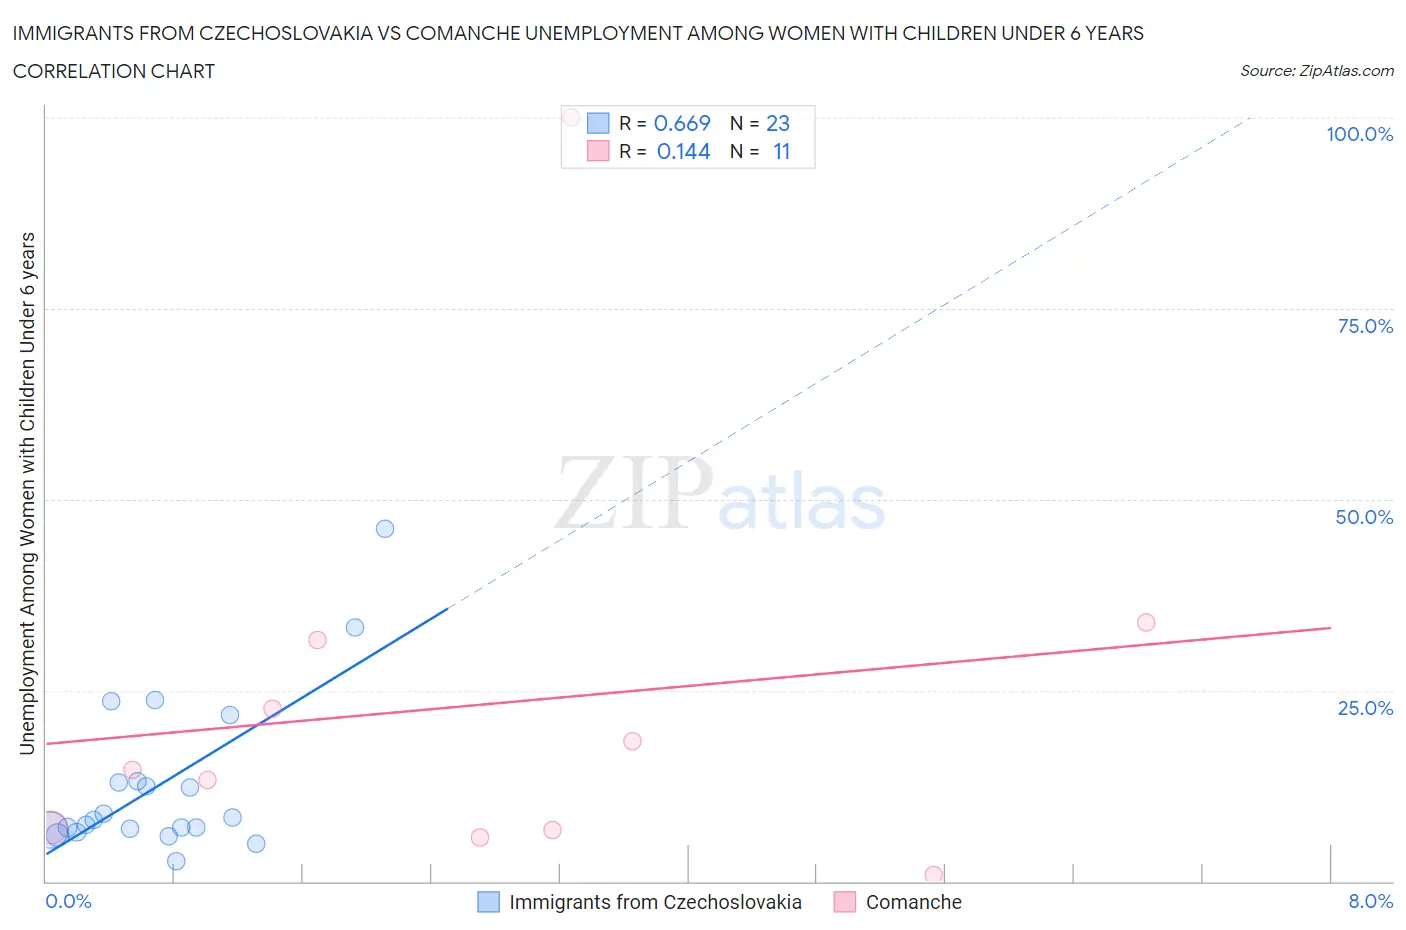
Immigrants from Czechoslovakia vs Comanche Unemployment Among Women with Children Under 6 years Correlation Chart
The statistical analysis conducted on geographies consisting of 163,653,873 people shows a significant positive correlation between the proportion of Immigrants from Czechoslovakia and unemployment rate among women with children under the age of 6 in the United States with a correlation coefficient (R) of 0.669 and weighted average of 7.0%. Similarly, the statistical analysis conducted on geographies consisting of 96,385,597 people shows a poor positive correlation between the proportion of Comanche and unemployment rate among women with children under the age of 6 in the United States with a correlation coefficient (R) of 0.144 and weighted average of 8.0%, a difference of 14.2%.
Unemployment Among Women with Children Under 6 years Correlation Summary
| Measurement | Immigrants from Czechoslovakia | Comanche |
| Minimum | 2.7% | 0.90% |
| Maximum | 46.2% | 100.0% |
| Range | 43.5% | 99.1% |
| Mean | 12.7% | 23.1% |
| Median | 8.0% | 14.6% |
| Interquartile 25% (IQ1) | 6.6% | 6.7% |
| Interquartile 75% (IQ3) | 13.2% | 31.6% |
| Interquartile Range (IQR) | 6.5% | 24.9% |
| Standard Deviation (Sample) | 10.5% | 27.6% |
| Standard Deviation (Population) | 10.2% | 26.3% |
Similar Demographics by Unemployment Among Women with Children Under 6 years
Demographics Similar to Immigrants from Czechoslovakia by Unemployment Among Women with Children Under 6 years
In terms of unemployment among women with children under 6 years, the demographic groups most similar to Immigrants from Czechoslovakia are Turkish (7.0%, a difference of 0.010%), Immigrants from Eastern Europe (7.1%, a difference of 0.40%), Estonian (7.1%, a difference of 0.45%), Immigrants from Croatia (7.1%, a difference of 0.49%), and Cuban (7.0%, a difference of 0.52%).
| Demographics | Rating | Rank | Unemployment Among Women with Children Under 6 years |
| Immigrants | Belgium | 99.6 /100 | #66 | Exceptional 6.9% |
| Immigrants | Netherlands | 99.5 /100 | #67 | Exceptional 7.0% |
| Paraguayans | 99.4 /100 | #68 | Exceptional 7.0% |
| Immigrants | Eritrea | 99.4 /100 | #69 | Exceptional 7.0% |
| Immigrants | Iraq | 99.4 /100 | #70 | Exceptional 7.0% |
| Afghans | 99.4 /100 | #71 | Exceptional 7.0% |
| Cubans | 99.4 /100 | #72 | Exceptional 7.0% |
| Immigrants | Czechoslovakia | 99.2 /100 | #73 | Exceptional 7.0% |
| Turks | 99.2 /100 | #74 | Exceptional 7.0% |
| Immigrants | Eastern Europe | 99.0 /100 | #75 | Exceptional 7.1% |
| Estonians | 99.0 /100 | #76 | Exceptional 7.1% |
| Immigrants | Croatia | 98.9 /100 | #77 | Exceptional 7.1% |
| Immigrants | Somalia | 98.9 /100 | #78 | Exceptional 7.1% |
| Immigrants | Fiji | 98.9 /100 | #79 | Exceptional 7.1% |
| Immigrants | Greece | 98.9 /100 | #80 | Exceptional 7.1% |
Demographics Similar to Comanche by Unemployment Among Women with Children Under 6 years
In terms of unemployment among women with children under 6 years, the demographic groups most similar to Comanche are Immigrants from Barbados (8.0%, a difference of 0.020%), Kiowa (8.0%, a difference of 0.040%), Immigrants from Costa Rica (8.0%, a difference of 0.080%), Immigrants from Trinidad and Tobago (8.0%, a difference of 0.18%), and Welsh (8.0%, a difference of 0.27%).
| Demographics | Rating | Rank | Unemployment Among Women with Children Under 6 years |
| Immigrants | Sudan | 6.0 /100 | #228 | Tragic 8.0% |
| Salvadorans | 5.5 /100 | #229 | Tragic 8.0% |
| Finns | 5.3 /100 | #230 | Tragic 8.0% |
| Trinidadians and Tobagonians | 5.3 /100 | #231 | Tragic 8.0% |
| Welsh | 5.0 /100 | #232 | Tragic 8.0% |
| Immigrants | Trinidad and Tobago | 4.8 /100 | #233 | Tragic 8.0% |
| Kiowa | 4.4 /100 | #234 | Tragic 8.0% |
| Comanche | 4.3 /100 | #235 | Tragic 8.0% |
| Immigrants | Barbados | 4.2 /100 | #236 | Tragic 8.0% |
| Immigrants | Costa Rica | 4.1 /100 | #237 | Tragic 8.0% |
| Immigrants | Middle Africa | 3.2 /100 | #238 | Tragic 8.1% |
| Irish | 2.7 /100 | #239 | Tragic 8.1% |
| Immigrants | El Salvador | 2.6 /100 | #240 | Tragic 8.1% |
| Liberians | 2.6 /100 | #241 | Tragic 8.1% |
| Dutch | 2.5 /100 | #242 | Tragic 8.1% |