Immigrants from Cuba vs Immigrants from Northern Europe Unemployment Among Women with Children Under 18 years
COMPARE
Immigrants from Cuba
Immigrants from Northern Europe
Unemployment Among Women with Children Under 18 years
Unemployment Among Women with Children Under 18 years Comparison
Immigrants from Cuba
Immigrants from Northern Europe
5.2%
UNEMPLOYMENT AMONG WOMEN WITH CHILDREN UNDER 18 YEARS
90.9/ 100
METRIC RATING
102nd/ 347
METRIC RANK
5.1%
UNEMPLOYMENT AMONG WOMEN WITH CHILDREN UNDER 18 YEARS
95.9/ 100
METRIC RATING
74th/ 347
METRIC RANK
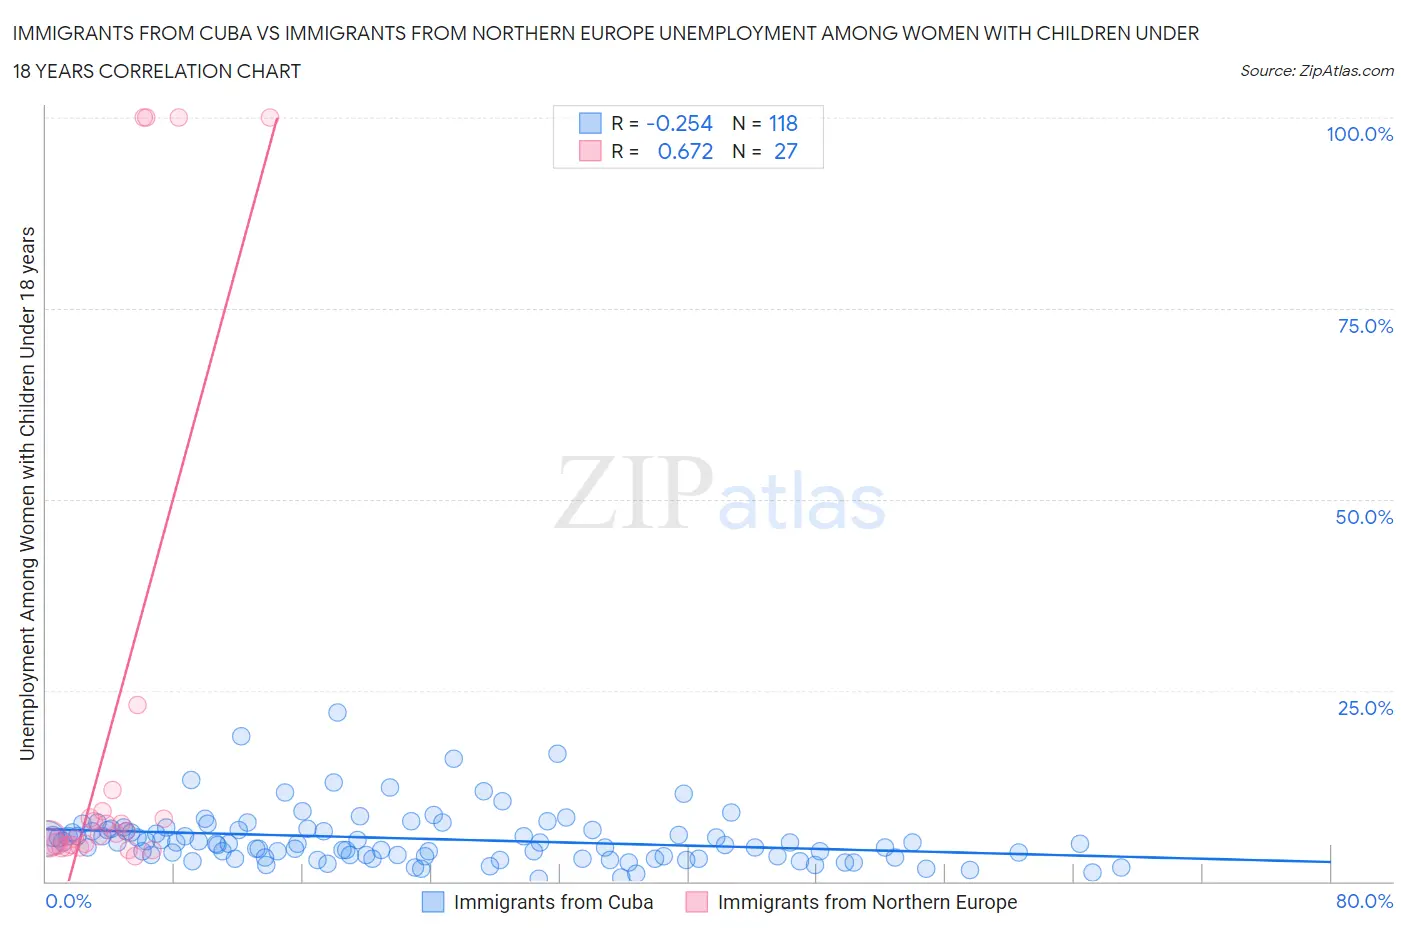
Immigrants from Cuba vs Immigrants from Northern Europe Unemployment Among Women with Children Under 18 years Correlation Chart
The statistical analysis conducted on geographies consisting of 316,364,577 people shows a weak negative correlation between the proportion of Immigrants from Cuba and unemployment rate among women with children under the age of 18 in the United States with a correlation coefficient (R) of -0.254 and weighted average of 5.2%. Similarly, the statistical analysis conducted on geographies consisting of 449,375,747 people shows a significant positive correlation between the proportion of Immigrants from Northern Europe and unemployment rate among women with children under the age of 18 in the United States with a correlation coefficient (R) of 0.672 and weighted average of 5.1%, a difference of 1.6%.
Unemployment Among Women with Children Under 18 years Correlation Summary
| Measurement | Immigrants from Cuba | Immigrants from Northern Europe |
| Minimum | 0.40% | 3.3% |
| Maximum | 22.0% | 100.0% |
| Range | 21.6% | 96.7% |
| Mean | 5.6% | 20.7% |
| Median | 4.9% | 6.2% |
| Interquartile 25% (IQ1) | 3.2% | 4.8% |
| Interquartile 75% (IQ3) | 6.7% | 9.1% |
| Interquartile Range (IQR) | 3.5% | 4.3% |
| Standard Deviation (Sample) | 3.6% | 33.9% |
| Standard Deviation (Population) | 3.6% | 33.3% |
Similar Demographics by Unemployment Among Women with Children Under 18 years
Demographics Similar to Immigrants from Cuba by Unemployment Among Women with Children Under 18 years
In terms of unemployment among women with children under 18 years, the demographic groups most similar to Immigrants from Cuba are Immigrants from Netherlands (5.2%, a difference of 0.010%), Immigrants from Greece (5.2%, a difference of 0.10%), Sri Lankan (5.2%, a difference of 0.15%), Immigrants from Switzerland (5.2%, a difference of 0.18%), and Cuban (5.2%, a difference of 0.19%).
| Demographics | Rating | Rank | Unemployment Among Women with Children Under 18 years |
| Immigrants | North America | 92.3 /100 | #95 | Exceptional 5.2% |
| Immigrants | Albania | 92.2 /100 | #96 | Exceptional 5.2% |
| Palestinians | 92.2 /100 | #97 | Exceptional 5.2% |
| Immigrants | Vietnam | 92.0 /100 | #98 | Exceptional 5.2% |
| Cubans | 91.8 /100 | #99 | Exceptional 5.2% |
| Immigrants | Greece | 91.4 /100 | #100 | Exceptional 5.2% |
| Immigrants | Netherlands | 91.0 /100 | #101 | Exceptional 5.2% |
| Immigrants | Cuba | 90.9 /100 | #102 | Exceptional 5.2% |
| Sri Lankans | 90.3 /100 | #103 | Exceptional 5.2% |
| Immigrants | Switzerland | 90.1 /100 | #104 | Exceptional 5.2% |
| Immigrants | France | 90.0 /100 | #105 | Excellent 5.2% |
| Pakistanis | 89.9 /100 | #106 | Excellent 5.2% |
| Slavs | 89.8 /100 | #107 | Excellent 5.2% |
| Iranians | 89.7 /100 | #108 | Excellent 5.2% |
| Immigrants | Russia | 89.0 /100 | #109 | Excellent 5.2% |
Demographics Similar to Immigrants from Northern Europe by Unemployment Among Women with Children Under 18 years
In terms of unemployment among women with children under 18 years, the demographic groups most similar to Immigrants from Northern Europe are Albanian (5.1%, a difference of 0.010%), Immigrants from Asia (5.1%, a difference of 0.030%), Puget Sound Salish (5.1%, a difference of 0.060%), Immigrants from Bolivia (5.1%, a difference of 0.080%), and Zimbabwean (5.1%, a difference of 0.080%).
| Demographics | Rating | Rank | Unemployment Among Women with Children Under 18 years |
| Fijians | 96.9 /100 | #67 | Exceptional 5.1% |
| Irish | 96.8 /100 | #68 | Exceptional 5.1% |
| Austrians | 96.6 /100 | #69 | Exceptional 5.1% |
| Icelanders | 96.6 /100 | #70 | Exceptional 5.1% |
| Serbians | 96.5 /100 | #71 | Exceptional 5.1% |
| Immigrants | Bolivia | 96.1 /100 | #72 | Exceptional 5.1% |
| Albanians | 95.9 /100 | #73 | Exceptional 5.1% |
| Immigrants | Northern Europe | 95.9 /100 | #74 | Exceptional 5.1% |
| Immigrants | Asia | 95.8 /100 | #75 | Exceptional 5.1% |
| Puget Sound Salish | 95.8 /100 | #76 | Exceptional 5.1% |
| Zimbabweans | 95.7 /100 | #77 | Exceptional 5.1% |
| Assyrians/Chaldeans/Syriacs | 95.7 /100 | #78 | Exceptional 5.1% |
| Immigrants | Croatia | 95.6 /100 | #79 | Exceptional 5.1% |
| Bolivians | 95.5 /100 | #80 | Exceptional 5.1% |
| Immigrants | Lithuania | 95.4 /100 | #81 | Exceptional 5.2% |