Immigrants from Croatia vs Cambodian Unemployment Among Ages 30 to 34 years

COMPARE

Immigrants from Croatia
Race
Ancestry
AfghanAfricanAlaska NativeAlaskan AthabascanAlbanianAleutAlsatianAmericanApacheArabArapahoArgentineanArmenianAssyrian/Chaldean/SyriacAustralianAustrianBahamianBangladeshiBarbadianBasqueBelgianBelizeanBermudanBhutaneseBlackfeetBolivianBrazilianBritishBritish West IndianBulgarianBurmeseCajunCanadianCape VerdeanCarpatho RusynCelticCentral AmericanCentral American IndianCherokeeCheyenneChickasawChileanChineseChippewaChoctawColombianColvilleComancheCosta RicanCreeCreekCroatianCrowCubanCypriotCzechCzechoslovakianDanishDelawareDominicanDutchDutch West IndianEastern EuropeanEcuadorianEgyptianEnglishEstonianEthiopianEuropeanFijianFilipinoFinnishFrenchFrench American IndianFrench CanadianGermanGerman RussianGhanaianGreekGuamanian/ChamorroGuatemalanGuyaneseHaitianHmongHonduranHopiHoumaHungarianIcelanderIndian (Asian)IndonesianInupiatIranianIraqiIrishIroquoisIsraeliItalianJamaicanJapaneseJordanianKenyanKiowaKoreanLaotianLatvianLebaneseLiberianLithuanianLumbeeLuxembourgerMacedonianMalaysianMalteseMarshalleseMenomineeMexicanMexican American IndianMongolianMoroccanNative HawaiianNavajoNepaleseNew ZealanderNicaraguanNigerianNorthern EuropeanNorwegianOkinawanOsageOttawaPaiutePakistaniPalestinianPanamanianParaguayanPennsylvania GermanPeruvianPimaPolishPortuguesePotawatomiPuebloPuerto RicanPuget Sound SalishRomanianRussianSalvadoranSamoanScandinavianScotch-IrishScottishSeminoleSenegaleseSerbianShoshoneSierra LeoneanSiouxSlavicSlovakSloveneSomaliSouth AfricanSouth AmericanSouth American IndianSoviet UnionSpaniardSpanishSpanish AmericanSpanish American IndianSri LankanSubsaharan AfricanSudaneseSwedishSwissSyrianTaiwaneseThaiTlingit-HaidaTohono O'OdhamTonganTrinidadian and TobagonianTsimshianTurkishU.S. Virgin IslanderUgandanUkrainianUruguayanUteVenezuelanVietnameseWelshWest IndianYakamaYaquiYugoslavianYumanYup'ikZimbabwean
Immigration
NonimmigrantsImmigrantsAfghanistanAfricaAlbaniaArgentinaArmeniaAsiaAustraliaAustriaBahamasBangladeshBarbadosBelarusBelgiumBelizeBoliviaBosnia and HerzegovinaBrazilBulgariaBurma/MyanmarCabo VerdeCambodiaCameroonCanadaCaribbeanCentral AmericaChileChinaColombiaCongoCosta RicaCroatiaCubaCzechoslovakiaDenmarkDominicaDominican RepublicEastern AfricaEastern AsiaEastern EuropeEcuadorEgyptEl SalvadorEnglandEritreaEthiopiaEuropeFijiFranceGermanyGhanaGreeceGrenadaGuatemalaGuyanaHaitiHondurasHong KongHungaryIndiaIndonesiaIranIraqIrelandIsraelItalyJamaicaJapanJordanKazakhstanKenyaKoreaKuwaitLaosLatin AmericaLatviaLebanonLiberiaLithuaniaMalaysiaMexicoMicronesiaMiddle AfricaMoldovaMoroccoNepalNetherlandsNicaraguaNigeriaNorth AmericaNorth MacedoniaNorthern AfricaNorthern EuropeNorwayOceaniaPakistanPanamaPeruPhilippinesPolandPortugalRomaniaRussiaSaudi ArabiaScotlandSenegalSerbiaSierra LeoneSingaporeSomaliaSouth AfricaSouth AmericaSouth Central AsiaSouth Eastern AsiaSouthern EuropeSpainSri LankaSt. Vincent and the GrenadinesSudanSwedenSwitzerlandSyriaTaiwanThailandTrinidad and TobagoTurkeyUgandaUkraineUruguayUzbekistanVenezuelaVietnamWest IndiesWestern AfricaWestern AsiaWestern EuropeYemenZaireZimbabweAzores
Cambodian
Race
Ancestry
AfghanAfricanAlaska NativeAlaskan AthabascanAlbanianAleutAlsatianAmericanApacheArabArapahoArgentineanArmenianAssyrian/Chaldean/SyriacAustralianAustrianBahamianBangladeshiBarbadianBasqueBelgianBelizeanBermudanBhutaneseBlackfeetBolivianBrazilianBritishBritish West IndianBulgarianBurmeseCajunCambodianCanadianCape VerdeanCarpatho RusynCelticCentral AmericanCentral American IndianCherokeeCheyenneChickasawChileanChineseChippewaChoctawColombianColvilleComancheCosta RicanCreeCreekCroatianCrowCubanCypriotCzechCzechoslovakianDanishDelawareDominicanDutchDutch West IndianEastern EuropeanEcuadorianEgyptianEnglishEstonianEthiopianEuropeanFijianFilipinoFinnishFrenchFrench American IndianFrench CanadianGermanGerman RussianGhanaianGreekGuamanian/ChamorroGuatemalanGuyaneseHaitianHmongHonduranHopiHoumaHungarianIcelanderIndian (Asian)IndonesianInupiatIranianIraqiIrishIroquoisIsraeliItalianJamaicanJapaneseJordanianKenyanKiowaKoreanLaotianLatvianLebaneseLiberianLithuanianLumbeeLuxembourgerMacedonianMalaysianMalteseMarshalleseMenomineeMexicanMexican American IndianMongolianMoroccanNative HawaiianNavajoNepaleseNew ZealanderNicaraguanNigerianNorthern EuropeanNorwegianOkinawanOsageOttawaPaiutePakistaniPalestinianPanamanianParaguayanPennsylvania GermanPeruvianPimaPolishPortuguesePotawatomiPuebloPuerto RicanPuget Sound SalishRomanianRussianSalvadoranSamoanScandinavianScotch-IrishScottishSeminoleSenegaleseSerbianShoshoneSierra LeoneanSiouxSlavicSlovakSloveneSomaliSouth AfricanSouth AmericanSouth American IndianSoviet UnionSpaniardSpanishSpanish AmericanSpanish American IndianSri LankanSubsaharan AfricanSudaneseSwedishSwissSyrianTaiwaneseThaiTlingit-HaidaTohono O'OdhamTonganTrinidadian and TobagonianTsimshianTurkishU.S. Virgin IslanderUgandanUkrainianUruguayanUteVenezuelanVietnameseWelshWest IndianYakamaYaquiYugoslavianYumanYup'ikZimbabwean
Immigration
NonimmigrantsImmigrantsAfghanistanAfricaAlbaniaArgentinaArmeniaAsiaAustraliaAustriaBahamasBangladeshBarbadosBelarusBelgiumBelizeBoliviaBosnia and HerzegovinaBrazilBulgariaBurma/MyanmarCabo VerdeCambodiaCameroonCanadaCaribbeanCentral AmericaChileChinaColombiaCongoCosta RicaCubaCzechoslovakiaDenmarkDominicaDominican RepublicEastern AfricaEastern AsiaEastern EuropeEcuadorEgyptEl SalvadorEnglandEritreaEthiopiaEuropeFijiFranceGermanyGhanaGreeceGrenadaGuatemalaGuyanaHaitiHondurasHong KongHungaryIndiaIndonesiaIranIraqIrelandIsraelItalyJamaicaJapanJordanKazakhstanKenyaKoreaKuwaitLaosLatin AmericaLatviaLebanonLiberiaLithuaniaMalaysiaMexicoMicronesiaMiddle AfricaMoldovaMoroccoNepalNetherlandsNicaraguaNigeriaNorth AmericaNorth MacedoniaNorthern AfricaNorthern EuropeNorwayOceaniaPakistanPanamaPeruPhilippinesPolandPortugalRomaniaRussiaSaudi ArabiaScotlandSenegalSerbiaSierra LeoneSingaporeSomaliaSouth AfricaSouth AmericaSouth Central AsiaSouth Eastern AsiaSouthern EuropeSpainSri LankaSt. Vincent and the GrenadinesSudanSwedenSwitzerlandSyriaTaiwanThailandTrinidad and TobagoTurkeyUgandaUkraineUruguayUzbekistanVenezuelaVietnamWest IndiesWestern AfricaWestern AsiaWestern EuropeYemenZaireZimbabweAzores
Unemployment Among Ages 30 to 34 years
Income
Poverty
Unemployment
Labor Participation
Family Structure
Vehicle Availability
Education Level
Disability

Unemployment Among Ages 30 to 34 years Comparison

Immigrants from Croatia

Cambodians

Good
Exceptional
5.4%
UNEMPLOYMENT AMONG AGES 30 TO 34 YEARS
61.0/ 100
METRIC RATING
159th/ 347
METRIC RANK
4.8%
UNEMPLOYMENT AMONG AGES 30 TO 34 YEARS
99.9/ 100
METRIC RATING
13th/ 347
METRIC RANK

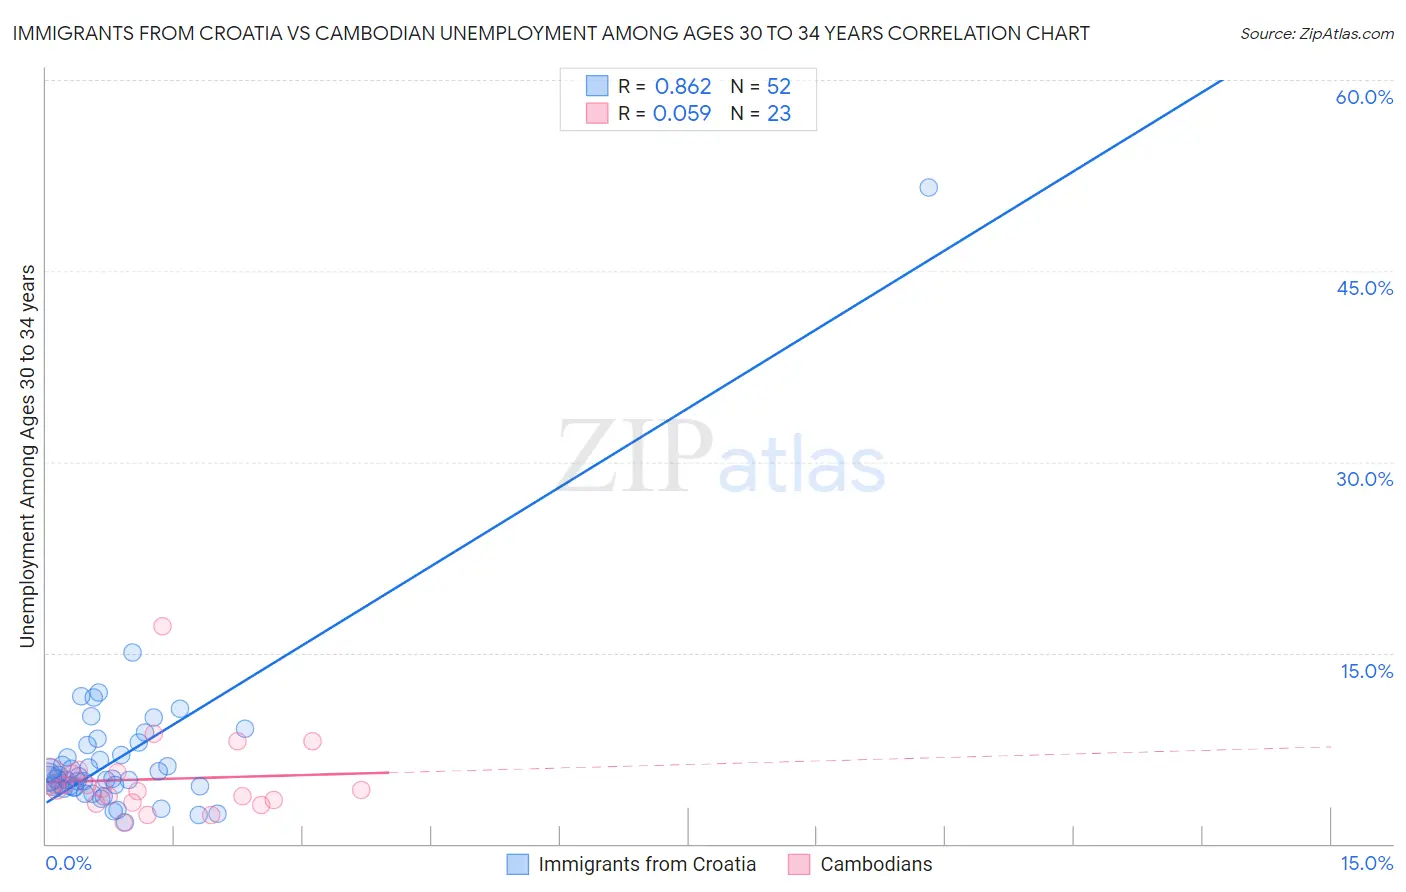
Immigrants from Croatia vs Cambodian Unemployment Among Ages 30 to 34 years Correlation Chart

The statistical analysis conducted on geographies consisting of 129,029,241 people shows a very strong positive correlation between the proportion of Immigrants from Croatia and unemployment rate among population between the ages 30 and 34 in the United States with a correlation coefficient (R) of 0.862 and weighted average of 5.4%. Similarly, the statistical analysis conducted on geographies consisting of 101,147,758 people shows a slight positive correlation between the proportion of Cambodians and unemployment rate among population between the ages 30 and 34 in the United States with a correlation coefficient (R) of 0.059 and weighted average of 4.8%, a difference of 12.6%.
Immigrants from Croatia vs Cambodian Unemployment Among Ages 30 to 34 years

Unemployment Among Ages 30 to 34 years Correlation Summary

MeasurementImmigrants from CroatiaCambodian
Minimum1.6%1.7%
Maximum51.6%17.1%
Range50.0%15.4%
Mean6.8%5.1%
Median5.1%4.2%
Interquartile 25% (IQ1)4.5%3.2%
Interquartile 75% (IQ3)7.3%5.6%
Interquartile Range (IQR)2.9%2.4%
Standard Deviation (Sample)6.9%3.2%
Standard Deviation (Population)6.8%3.1%

Similar Demographics by Unemployment Among Ages 30 to 34 years

Demographics Similar to Immigrants from Croatia by Unemployment Among Ages 30 to 34 years

In terms of unemployment among ages 30 to 34 years, the demographic groups most similar to Immigrants from Croatia are Immigrants from Belarus (5.4%, a difference of 0.12%), Immigrants from Scotland (5.4%, a difference of 0.13%), Austrian (5.4%, a difference of 0.15%), Czechoslovakian (5.4%, a difference of 0.20%), and Albanian (5.4%, a difference of 0.20%).
DemographicsRating | RankUnemployment Among Ages 30 to 34 years
Lebanese
67.2
/100
|
#152
Good
5.4%
Immigrants | South Eastern Asia
66.5
/100
|
#153
Good
5.4%
South Africans
66.5
/100
|
#154
Good
5.4%
Immigrants | Hungary
66.1
/100
|
#155
Good
5.4%
Czechoslovakians
63.7
/100
|
#156
Good
5.4%
Albanians
63.7
/100
|
#157
Good
5.4%
Immigrants | Belarus
62.7
/100
|
#158
Good
5.4%
Immigrants | Croatia
61.0
/100
|
#159
Good
5.4%
Immigrants | Scotland
59.3
/100
|
#160
Average
5.4%
Austrians
59.0
/100
|
#161
Average
5.4%
Brazilians
58.2
/100
|
#162
Average
5.4%
Arabs
57.7
/100
|
#163
Average
5.4%
Basques
57.3
/100
|
#164
Average
5.4%
Welsh
56.3
/100
|
#165
Average
5.4%
Immigrants | Thailand
55.6
/100
|
#166
Average
5.4%

Demographics Similar to Cambodians by Unemployment Among Ages 30 to 34 years

In terms of unemployment among ages 30 to 34 years, the demographic groups most similar to Cambodians are Filipino (4.8%, a difference of 0.0%), Luxembourger (4.8%, a difference of 0.010%), Okinawan (4.8%, a difference of 0.38%), Zimbabwean (4.8%, a difference of 0.49%), and Immigrants from Bulgaria (4.8%, a difference of 0.60%).
DemographicsRating | RankUnemployment Among Ages 30 to 34 years
Immigrants | Bosnia and Herzegovina
100.0
/100
|
#6
Exceptional
4.7%
Thais
100.0
/100
|
#7
Exceptional
4.7%
Immigrants | Eritrea
100.0
/100
|
#8
Exceptional
4.7%
Bulgarians
99.9
/100
|
#9
Exceptional
4.7%
Tongans
99.9
/100
|
#10
Exceptional
4.8%
Immigrants | Bolivia
99.9
/100
|
#11
Exceptional
4.8%
Filipinos
99.9
/100
|
#12
Exceptional
4.8%
Cambodians
99.9
/100
|
#13
Exceptional
4.8%
Luxembourgers
99.9
/100
|
#14
Exceptional
4.8%
Okinawans
99.9
/100
|
#15
Exceptional
4.8%
Zimbabweans
99.9
/100
|
#16
Exceptional
4.8%
Immigrants | Bulgaria
99.9
/100
|
#17
Exceptional
4.8%
Bolivians
99.8
/100
|
#18
Exceptional
4.9%
Immigrants | Sudan
99.8
/100
|
#19
Exceptional
4.9%
Immigrants | Taiwan
99.8
/100
|
#20
Exceptional
4.9%