Immigrants from Costa Rica vs Trinidadian and Tobagonian Unemployment Among Ages 25 to 29 years
COMPARE
Immigrants from Costa Rica
Trinidadian and Tobagonian
Unemployment Among Ages 25 to 29 years
Unemployment Among Ages 25 to 29 years Comparison
Immigrants from Costa Rica
Trinidadians and Tobagonians
6.7%
UNEMPLOYMENT AMONG AGES 25 TO 29 YEARS
38.3/ 100
METRIC RATING
184th/ 347
METRIC RANK
7.8%
UNEMPLOYMENT AMONG AGES 25 TO 29 YEARS
0.0/ 100
METRIC RATING
294th/ 347
METRIC RANK
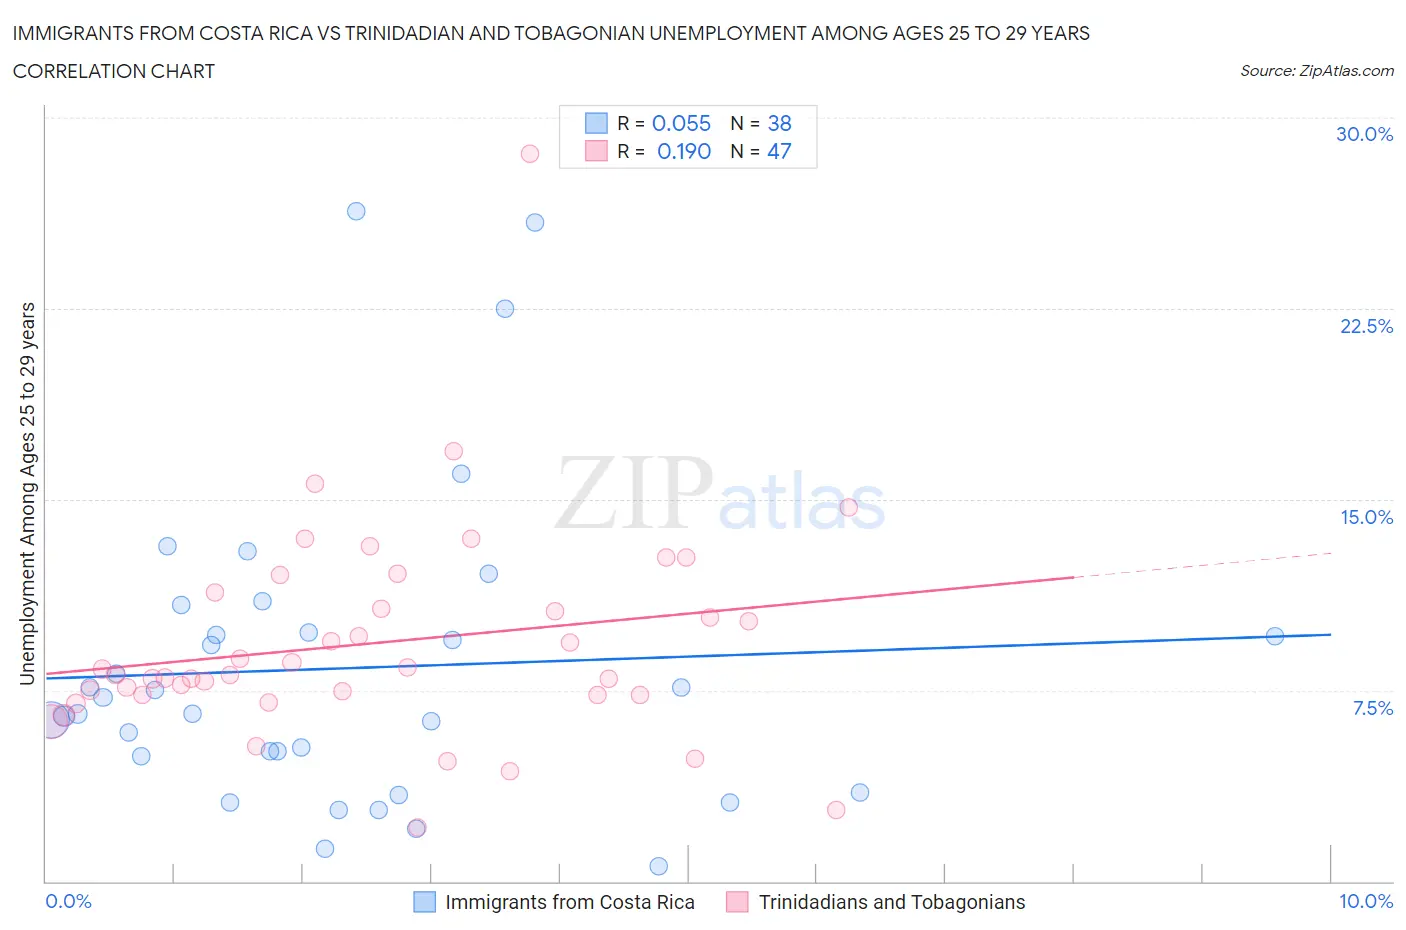
Immigrants from Costa Rica vs Trinidadian and Tobagonian Unemployment Among Ages 25 to 29 years Correlation Chart
The statistical analysis conducted on geographies consisting of 199,784,967 people shows a slight positive correlation between the proportion of Immigrants from Costa Rica and unemployment rate among population between the ages 25 and 29 in the United States with a correlation coefficient (R) of 0.055 and weighted average of 6.7%. Similarly, the statistical analysis conducted on geographies consisting of 214,424,084 people shows a poor positive correlation between the proportion of Trinidadians and Tobagonians and unemployment rate among population between the ages 25 and 29 in the United States with a correlation coefficient (R) of 0.190 and weighted average of 7.8%, a difference of 16.3%.
Unemployment Among Ages 25 to 29 years Correlation Summary
| Measurement | Immigrants from Costa Rica | Trinidadian and Tobagonian |
| Minimum | 0.60% | 2.1% |
| Maximum | 26.3% | 28.6% |
| Range | 25.7% | 26.5% |
| Mean | 8.4% | 9.4% |
| Median | 6.9% | 8.1% |
| Interquartile 25% (IQ1) | 4.9% | 7.3% |
| Interquartile 75% (IQ3) | 9.8% | 11.3% |
| Interquartile Range (IQR) | 4.9% | 4.0% |
| Standard Deviation (Sample) | 6.0% | 4.3% |
| Standard Deviation (Population) | 6.0% | 4.2% |
Similar Demographics by Unemployment Among Ages 25 to 29 years
Demographics Similar to Immigrants from Costa Rica by Unemployment Among Ages 25 to 29 years
In terms of unemployment among ages 25 to 29 years, the demographic groups most similar to Immigrants from Costa Rica are Immigrants from Scotland (6.7%, a difference of 0.090%), Czechoslovakian (6.7%, a difference of 0.15%), Moroccan (6.7%, a difference of 0.16%), Immigrants from Africa (6.7%, a difference of 0.18%), and Immigrants from Western Europe (6.7%, a difference of 0.18%).
| Demographics | Rating | Rank | Unemployment Among Ages 25 to 29 years |
| Immigrants | Israel | 47.8 /100 | #177 | Average 6.7% |
| Immigrants | Iraq | 45.1 /100 | #178 | Average 6.7% |
| Costa Ricans | 44.9 /100 | #179 | Average 6.7% |
| Immigrants | Africa | 41.1 /100 | #180 | Average 6.7% |
| Immigrants | Western Europe | 41.1 /100 | #181 | Average 6.7% |
| Czechoslovakians | 40.7 /100 | #182 | Average 6.7% |
| Immigrants | Scotland | 39.6 /100 | #183 | Fair 6.7% |
| Immigrants | Costa Rica | 38.3 /100 | #184 | Fair 6.7% |
| Moroccans | 35.9 /100 | #185 | Fair 6.7% |
| Immigrants | Iran | 34.4 /100 | #186 | Fair 6.7% |
| Immigrants | South America | 33.0 /100 | #187 | Fair 6.7% |
| Irish | 32.8 /100 | #188 | Fair 6.7% |
| Argentineans | 32.1 /100 | #189 | Fair 6.7% |
| Koreans | 29.3 /100 | #190 | Fair 6.7% |
| Chickasaw | 28.7 /100 | #191 | Fair 6.7% |
Demographics Similar to Trinidadians and Tobagonians by Unemployment Among Ages 25 to 29 years
In terms of unemployment among ages 25 to 29 years, the demographic groups most similar to Trinidadians and Tobagonians are Immigrants from Belize (7.8%, a difference of 0.28%), Chippewa (7.8%, a difference of 0.33%), Comanche (7.8%, a difference of 0.46%), Immigrants from West Indies (7.8%, a difference of 0.59%), and Hispanic or Latino (7.7%, a difference of 0.74%).
| Demographics | Rating | Rank | Unemployment Among Ages 25 to 29 years |
| Immigrants | Mexico | 0.0 /100 | #287 | Tragic 7.6% |
| Africans | 0.0 /100 | #288 | Tragic 7.6% |
| Belizeans | 0.0 /100 | #289 | Tragic 7.7% |
| Armenians | 0.0 /100 | #290 | Tragic 7.7% |
| Hispanics or Latinos | 0.0 /100 | #291 | Tragic 7.7% |
| Chippewa | 0.0 /100 | #292 | Tragic 7.8% |
| Immigrants | Belize | 0.0 /100 | #293 | Tragic 7.8% |
| Trinidadians and Tobagonians | 0.0 /100 | #294 | Tragic 7.8% |
| Comanche | 0.0 /100 | #295 | Tragic 7.8% |
| Immigrants | West Indies | 0.0 /100 | #296 | Tragic 7.8% |
| Blackfeet | 0.0 /100 | #297 | Tragic 7.9% |
| Immigrants | Trinidad and Tobago | 0.0 /100 | #298 | Tragic 7.9% |
| Barbadians | 0.0 /100 | #299 | Tragic 7.9% |
| Central American Indians | 0.0 /100 | #300 | Tragic 7.9% |
| West Indians | 0.0 /100 | #301 | Tragic 7.9% |