Immigrants from Congo vs Serbian Unemployment Among Youth under 25 years
COMPARE
Immigrants from Congo
Serbian
Unemployment Among Youth under 25 years
Unemployment Among Youth under 25 years Comparison
Immigrants from Congo
Serbians
10.9%
UNEMPLOYMENT AMONG YOUTH UNDER 25 YEARS
99.8/ 100
METRIC RATING
38th/ 347
METRIC RANK
11.0%
UNEMPLOYMENT AMONG YOUTH UNDER 25 YEARS
99.0/ 100
METRIC RATING
51st/ 347
METRIC RANK
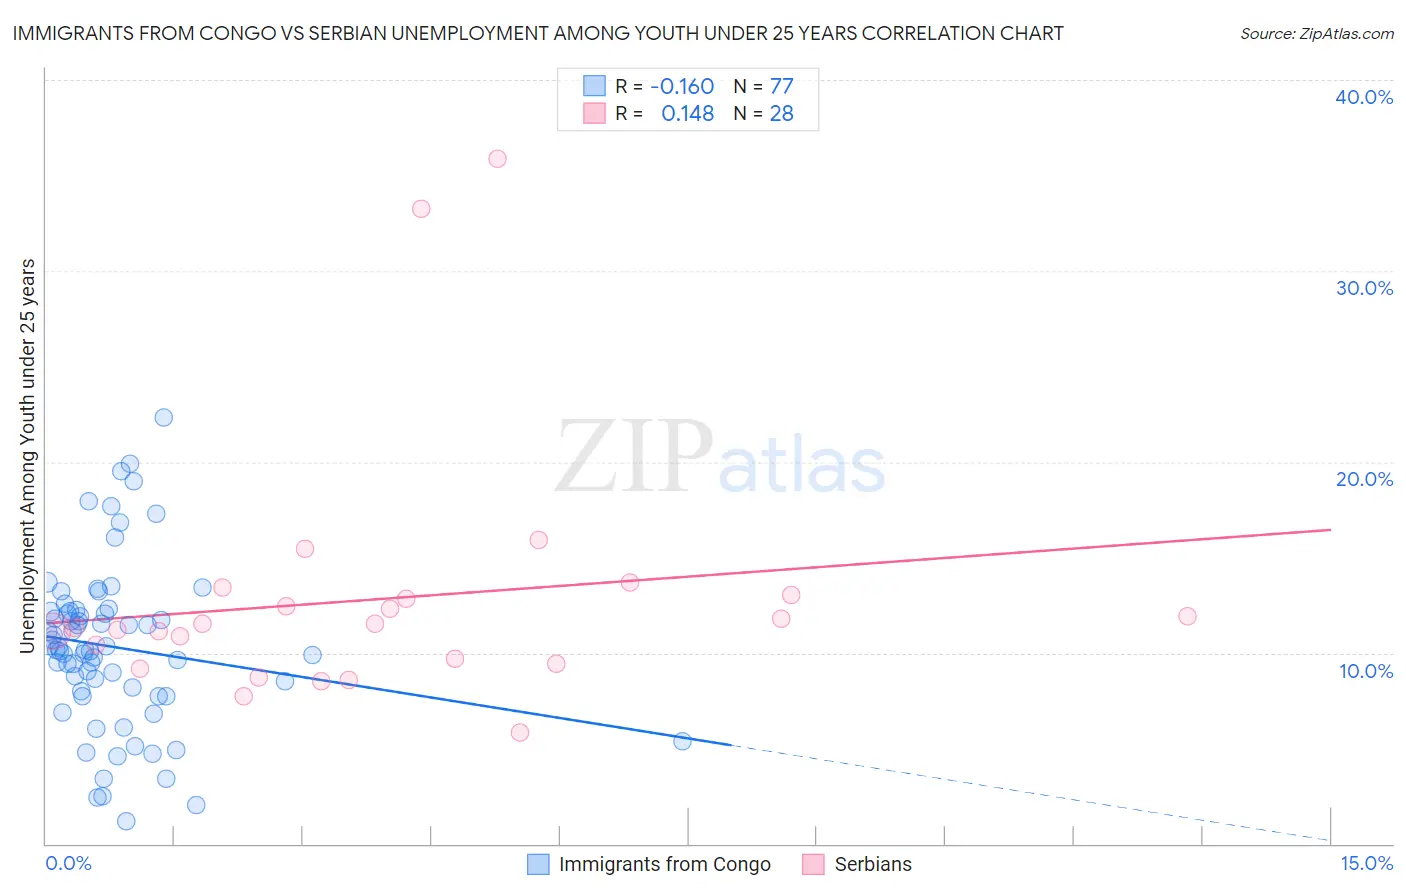
Immigrants from Congo vs Serbian Unemployment Among Youth under 25 years Correlation Chart
The statistical analysis conducted on geographies consisting of 91,969,114 people shows a poor negative correlation between the proportion of Immigrants from Congo and unemployment rate among youth under the age of 25 in the United States with a correlation coefficient (R) of -0.160 and weighted average of 10.9%. Similarly, the statistical analysis conducted on geographies consisting of 265,082,156 people shows a poor positive correlation between the proportion of Serbians and unemployment rate among youth under the age of 25 in the United States with a correlation coefficient (R) of 0.148 and weighted average of 11.0%, a difference of 1.8%.
Unemployment Among Youth under 25 years Correlation Summary
| Measurement | Immigrants from Congo | Serbian |
| Minimum | 1.2% | 5.8% |
| Maximum | 22.3% | 35.9% |
| Range | 21.1% | 30.1% |
| Mean | 10.3% | 12.8% |
| Median | 10.2% | 11.4% |
| Interquartile 25% (IQ1) | 7.8% | 9.6% |
| Interquartile 75% (IQ3) | 12.2% | 12.9% |
| Interquartile Range (IQR) | 4.3% | 3.4% |
| Standard Deviation (Sample) | 4.3% | 6.5% |
| Standard Deviation (Population) | 4.2% | 6.4% |
Demographics Similar to Immigrants from Congo and Serbians by Unemployment Among Youth under 25 years
In terms of unemployment among youth under 25 years, the demographic groups most similar to Immigrants from Congo are Immigrants from Zaire (10.9%, a difference of 0.010%), Immigrants from Zimbabwe (10.8%, a difference of 0.070%), Scottish (10.9%, a difference of 0.17%), Hmong (10.8%, a difference of 0.23%), and Croatian (10.9%, a difference of 0.27%). Similarly, the demographic groups most similar to Serbians are Latvian (11.0%, a difference of 0.020%), Ottawa (11.1%, a difference of 0.10%), Mongolian (11.1%, a difference of 0.19%), Czechoslovakian (11.0%, a difference of 0.23%), and Thai (11.0%, a difference of 0.33%).
| Demographics | Rating | Rank | Unemployment Among Youth under 25 years |
| English | 99.9 /100 | #34 | Exceptional 10.8% |
| Immigrants | Nepal | 99.9 /100 | #35 | Exceptional 10.8% |
| Hmong | 99.8 /100 | #36 | Exceptional 10.8% |
| Immigrants | Zimbabwe | 99.8 /100 | #37 | Exceptional 10.8% |
| Immigrants | Congo | 99.8 /100 | #38 | Exceptional 10.9% |
| Immigrants | Zaire | 99.8 /100 | #39 | Exceptional 10.9% |
| Scottish | 99.8 /100 | #40 | Exceptional 10.9% |
| Croatians | 99.8 /100 | #41 | Exceptional 10.9% |
| Cambodians | 99.7 /100 | #42 | Exceptional 10.9% |
| British | 99.7 /100 | #43 | Exceptional 10.9% |
| Welsh | 99.7 /100 | #44 | Exceptional 10.9% |
| Bulgarians | 99.6 /100 | #45 | Exceptional 10.9% |
| Tongans | 99.6 /100 | #46 | Exceptional 10.9% |
| Australians | 99.6 /100 | #47 | Exceptional 10.9% |
| Poles | 99.3 /100 | #48 | Exceptional 11.0% |
| Thais | 99.3 /100 | #49 | Exceptional 11.0% |
| Czechoslovakians | 99.2 /100 | #50 | Exceptional 11.0% |
| Serbians | 99.0 /100 | #51 | Exceptional 11.0% |
| Latvians | 99.0 /100 | #52 | Exceptional 11.0% |
| Ottawa | 99.0 /100 | #53 | Exceptional 11.1% |
| Mongolians | 98.9 /100 | #54 | Exceptional 11.1% |