Immigrants from Congo vs Romanian Unemployment Among Ages 20 to 24 years

COMPARE

Immigrants from Congo
Race
Ancestry
AfghanAfricanAlaska NativeAlaskan AthabascanAlbanianAleutAlsatianAmericanApacheArabArapahoArgentineanArmenianAssyrian/Chaldean/SyriacAustralianAustrianBahamianBangladeshiBarbadianBasqueBelgianBelizeanBermudanBhutaneseBlackfeetBolivianBrazilianBritishBritish West IndianBulgarianBurmeseCajunCambodianCanadianCape VerdeanCarpatho RusynCelticCentral AmericanCentral American IndianCherokeeCheyenneChickasawChileanChineseChippewaChoctawColombianColvilleComancheCosta RicanCreeCreekCroatianCrowCubanCypriotCzechCzechoslovakianDanishDelawareDominicanDutchDutch West IndianEastern EuropeanEcuadorianEgyptianEnglishEstonianEthiopianEuropeanFijianFilipinoFinnishFrenchFrench American IndianFrench CanadianGermanGerman RussianGhanaianGreekGuamanian/ChamorroGuatemalanGuyaneseHaitianHmongHonduranHopiHoumaHungarianIcelanderIndian (Asian)IndonesianInupiatIranianIraqiIrishIroquoisIsraeliItalianJamaicanJapaneseJordanianKenyanKiowaKoreanLaotianLatvianLebaneseLiberianLithuanianLumbeeLuxembourgerMacedonianMalaysianMalteseMarshalleseMenomineeMexicanMexican American IndianMongolianMoroccanNative HawaiianNavajoNepaleseNew ZealanderNicaraguanNigerianNorthern EuropeanNorwegianOkinawanOsageOttawaPaiutePakistaniPalestinianPanamanianParaguayanPennsylvania GermanPeruvianPimaPolishPortuguesePotawatomiPuebloPuerto RicanPuget Sound SalishRussianSalvadoranSamoanScandinavianScotch-IrishScottishSeminoleSenegaleseSerbianShoshoneSierra LeoneanSiouxSlavicSlovakSloveneSomaliSouth AfricanSouth AmericanSouth American IndianSoviet UnionSpaniardSpanishSpanish AmericanSpanish American IndianSri LankanSubsaharan AfricanSudaneseSwedishSwissSyrianTaiwaneseThaiTlingit-HaidaTohono O'OdhamTonganTrinidadian and TobagonianTsimshianTurkishU.S. Virgin IslanderUgandanUkrainianUruguayanUteVenezuelanVietnameseWelshWest IndianYakamaYaquiYugoslavianYumanYup'ikZimbabwean
Immigration
NonimmigrantsImmigrantsAfghanistanAfricaAlbaniaArgentinaArmeniaAsiaAustraliaAustriaBahamasBangladeshBarbadosBelarusBelgiumBelizeBoliviaBosnia and HerzegovinaBrazilBulgariaBurma/MyanmarCabo VerdeCambodiaCameroonCanadaCaribbeanCentral AmericaChileChinaColombiaCongoCosta RicaCroatiaCubaCzechoslovakiaDenmarkDominicaDominican RepublicEastern AfricaEastern AsiaEastern EuropeEcuadorEgyptEl SalvadorEnglandEritreaEthiopiaEuropeFijiFranceGermanyGhanaGreeceGrenadaGuatemalaGuyanaHaitiHondurasHong KongHungaryIndiaIndonesiaIranIraqIrelandIsraelItalyJamaicaJapanJordanKazakhstanKenyaKoreaKuwaitLaosLatin AmericaLatviaLebanonLiberiaLithuaniaMalaysiaMexicoMicronesiaMiddle AfricaMoldovaMoroccoNepalNetherlandsNicaraguaNigeriaNorth AmericaNorth MacedoniaNorthern AfricaNorthern EuropeNorwayOceaniaPakistanPanamaPeruPhilippinesPolandPortugalRomaniaRussiaSaudi ArabiaScotlandSenegalSerbiaSierra LeoneSingaporeSomaliaSouth AfricaSouth AmericaSouth Central AsiaSouth Eastern AsiaSouthern EuropeSpainSri LankaSt. Vincent and the GrenadinesSudanSwedenSwitzerlandSyriaTaiwanThailandTrinidad and TobagoTurkeyUgandaUkraineUruguayUzbekistanVenezuelaVietnamWest IndiesWestern AfricaWestern AsiaWestern EuropeYemenZaireZimbabweAzores
Romanian
Race
Ancestry
AfghanAfricanAlaska NativeAlaskan AthabascanAlbanianAleutAlsatianAmericanApacheArabArapahoArgentineanArmenianAssyrian/Chaldean/SyriacAustralianAustrianBahamianBangladeshiBarbadianBasqueBelgianBelizeanBermudanBhutaneseBlackfeetBolivianBrazilianBritishBritish West IndianBulgarianBurmeseCajunCambodianCanadianCape VerdeanCarpatho RusynCelticCentral AmericanCentral American IndianCherokeeCheyenneChickasawChileanChineseChippewaChoctawColombianColvilleComancheCosta RicanCreeCreekCroatianCrowCubanCypriotCzechCzechoslovakianDanishDelawareDominicanDutchDutch West IndianEastern EuropeanEcuadorianEgyptianEnglishEstonianEthiopianEuropeanFijianFilipinoFinnishFrenchFrench American IndianFrench CanadianGermanGerman RussianGhanaianGreekGuamanian/ChamorroGuatemalanGuyaneseHaitianHmongHonduranHopiHoumaHungarianIcelanderIndian (Asian)IndonesianInupiatIranianIraqiIrishIroquoisIsraeliItalianJamaicanJapaneseJordanianKenyanKiowaKoreanLaotianLatvianLebaneseLiberianLithuanianLumbeeLuxembourgerMacedonianMalaysianMalteseMarshalleseMenomineeMexicanMexican American IndianMongolianMoroccanNative HawaiianNavajoNepaleseNew ZealanderNicaraguanNigerianNorthern EuropeanNorwegianOkinawanOsageOttawaPaiutePakistaniPalestinianPanamanianParaguayanPennsylvania GermanPeruvianPimaPolishPortuguesePotawatomiPuebloPuerto RicanPuget Sound SalishRomanianRussianSalvadoranSamoanScandinavianScotch-IrishScottishSeminoleSenegaleseSerbianShoshoneSierra LeoneanSiouxSlavicSlovakSloveneSomaliSouth AfricanSouth AmericanSouth American IndianSoviet UnionSpaniardSpanishSpanish AmericanSpanish American IndianSri LankanSubsaharan AfricanSudaneseSwedishSwissSyrianTaiwaneseThaiTlingit-HaidaTohono O'OdhamTonganTrinidadian and TobagonianTsimshianTurkishU.S. Virgin IslanderUgandanUkrainianUruguayanUteVenezuelanVietnameseWelshWest IndianYakamaYaquiYugoslavianYumanYup'ikZimbabwean
Immigration
NonimmigrantsImmigrantsAfghanistanAfricaAlbaniaArgentinaArmeniaAsiaAustraliaAustriaBahamasBangladeshBarbadosBelarusBelgiumBelizeBoliviaBosnia and HerzegovinaBrazilBulgariaBurma/MyanmarCabo VerdeCambodiaCameroonCanadaCaribbeanCentral AmericaChileChinaColombiaCosta RicaCroatiaCubaCzechoslovakiaDenmarkDominicaDominican RepublicEastern AfricaEastern AsiaEastern EuropeEcuadorEgyptEl SalvadorEnglandEritreaEthiopiaEuropeFijiFranceGermanyGhanaGreeceGrenadaGuatemalaGuyanaHaitiHondurasHong KongHungaryIndiaIndonesiaIranIraqIrelandIsraelItalyJamaicaJapanJordanKazakhstanKenyaKoreaKuwaitLaosLatin AmericaLatviaLebanonLiberiaLithuaniaMalaysiaMexicoMicronesiaMiddle AfricaMoldovaMoroccoNepalNetherlandsNicaraguaNigeriaNorth AmericaNorth MacedoniaNorthern AfricaNorthern EuropeNorwayOceaniaPakistanPanamaPeruPhilippinesPolandPortugalRomaniaRussiaSaudi ArabiaScotlandSenegalSerbiaSierra LeoneSingaporeSomaliaSouth AfricaSouth AmericaSouth Central AsiaSouth Eastern AsiaSouthern EuropeSpainSri LankaSt. Vincent and the GrenadinesSudanSwedenSwitzerlandSyriaTaiwanThailandTrinidad and TobagoTurkeyUgandaUkraineUruguayUzbekistanVenezuelaVietnamWest IndiesWestern AfricaWestern AsiaWestern EuropeYemenZaireZimbabweAzores
Unemployment Among Ages 20 to 24 years
Income
Poverty
Unemployment
Labor Participation
Family Structure
Vehicle Availability
Education Level
Disability

Unemployment Among Ages 20 to 24 years Comparison

Immigrants from Congo

Romanians

Exceptional
Excellent
9.2%
UNEMPLOYMENT AMONG AGES 20 TO 24 YEARS
100.0/ 100
METRIC RATING
13th/ 347
METRIC RANK
10.2%
UNEMPLOYMENT AMONG AGES 20 TO 24 YEARS
83.8/ 100
METRIC RATING
134th/ 347
METRIC RANK

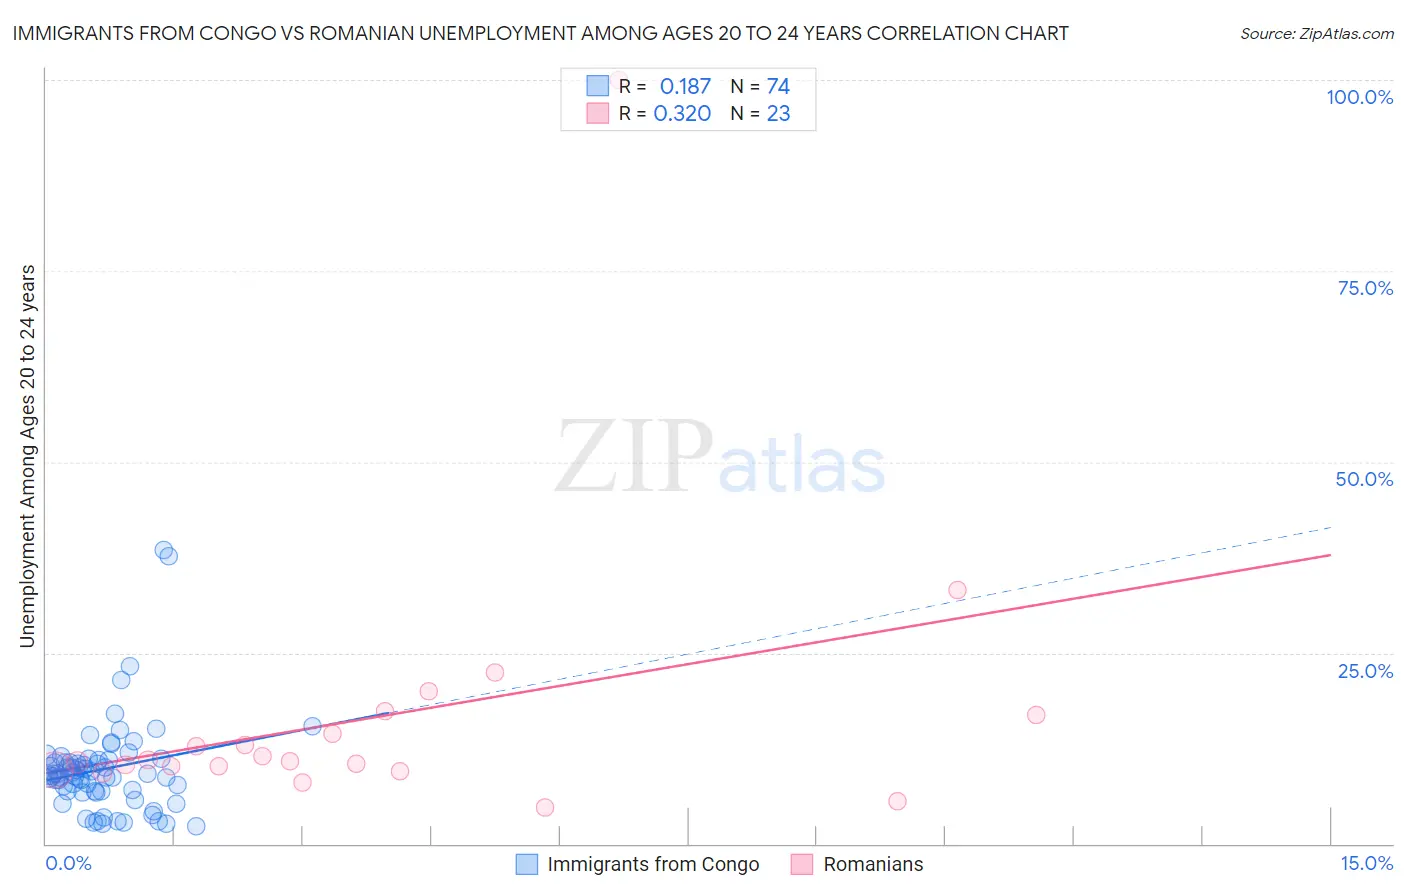
Immigrants from Congo vs Romanian Unemployment Among Ages 20 to 24 years Correlation Chart

The statistical analysis conducted on geographies consisting of 91,573,819 people shows a poor positive correlation between the proportion of Immigrants from Congo and unemployment rate among population between the ages 20 and 24 in the United States with a correlation coefficient (R) of 0.187 and weighted average of 9.2%. Similarly, the statistical analysis conducted on geographies consisting of 366,181,336 people shows a mild positive correlation between the proportion of Romanians and unemployment rate among population between the ages 20 and 24 in the United States with a correlation coefficient (R) of 0.320 and weighted average of 10.2%, a difference of 10.0%.
Immigrants from Congo vs Romanian Unemployment Among Ages 20 to 24 years

Unemployment Among Ages 20 to 24 years Correlation Summary

MeasurementImmigrants from CongoRomanian
Minimum2.3%4.8%
Maximum38.5%100.0%
Range36.2%95.2%
Mean9.8%16.6%
Median9.1%10.8%
Interquartile 25% (IQ1)6.9%9.6%
Interquartile 75% (IQ3)11.0%16.8%
Interquartile Range (IQR)4.0%7.2%
Standard Deviation (Sample)6.2%19.2%
Standard Deviation (Population)6.2%18.8%

Similar Demographics by Unemployment Among Ages 20 to 24 years

Demographics Similar to Immigrants from Congo by Unemployment Among Ages 20 to 24 years

In terms of unemployment among ages 20 to 24 years, the demographic groups most similar to Immigrants from Congo are Cuban (9.2%, a difference of 0.080%), Zimbabwean (9.2%, a difference of 0.18%), Slovene (9.3%, a difference of 0.38%), Immigrants from Sudan (9.3%, a difference of 0.41%), and Danish (9.3%, a difference of 0.57%).
DemographicsRating | RankUnemployment Among Ages 20 to 24 years
Immigrants | Burma/Myanmar
100.0
/100
|
#6
Exceptional
9.1%
Luxembourgers
100.0
/100
|
#7
Exceptional
9.1%
Somalis
100.0
/100
|
#8
Exceptional
9.1%
Immigrants | Somalia
100.0
/100
|
#9
Exceptional
9.2%
Sudanese
100.0
/100
|
#10
Exceptional
9.2%
Zimbabweans
100.0
/100
|
#11
Exceptional
9.2%
Cubans
100.0
/100
|
#12
Exceptional
9.2%
Immigrants | Congo
100.0
/100
|
#13
Exceptional
9.2%
Slovenes
100.0
/100
|
#14
Exceptional
9.3%
Immigrants | Sudan
100.0
/100
|
#15
Exceptional
9.3%
Danes
100.0
/100
|
#16
Exceptional
9.3%
Czechs
100.0
/100
|
#17
Exceptional
9.3%
Chinese
100.0
/100
|
#18
Exceptional
9.4%
Hmong
100.0
/100
|
#19
Exceptional
9.4%
Osage
100.0
/100
|
#20
Exceptional
9.4%

Demographics Similar to Romanians by Unemployment Among Ages 20 to 24 years

In terms of unemployment among ages 20 to 24 years, the demographic groups most similar to Romanians are Austrian (10.2%, a difference of 0.010%), Immigrants from South Eastern Asia (10.1%, a difference of 0.020%), Immigrants from Lithuania (10.1%, a difference of 0.030%), Seminole (10.1%, a difference of 0.030%), and Comanche (10.2%, a difference of 0.030%).
DemographicsRating | RankUnemployment Among Ages 20 to 24 years
Immigrants | Norway
85.3
/100
|
#127
Excellent
10.1%
Immigrants | Brazil
84.9
/100
|
#128
Excellent
10.1%
Immigrants | South Central Asia
84.6
/100
|
#129
Excellent
10.1%
Immigrants | Lithuania
84.2
/100
|
#130
Excellent
10.1%
Seminole
84.2
/100
|
#131
Excellent
10.1%
Immigrants | South Eastern Asia
84.0
/100
|
#132
Excellent
10.1%
Austrians
83.9
/100
|
#133
Excellent
10.2%
Romanians
83.8
/100
|
#134
Excellent
10.2%
Comanche
83.4
/100
|
#135
Excellent
10.2%
Immigrants | Northern Africa
82.5
/100
|
#136
Excellent
10.2%
Immigrants | North America
82.5
/100
|
#137
Excellent
10.2%
Burmese
82.3
/100
|
#138
Excellent
10.2%
Uruguayans
81.9
/100
|
#139
Excellent
10.2%
Immigrants | Austria
81.4
/100
|
#140
Excellent
10.2%
Immigrants | Azores
81.4
/100
|
#141
Excellent
10.2%