Immigrants from Colombia vs Immigrants from Western Europe Unemployment Among Ages 35 to 44 years

COMPARE

Immigrants from Colombia
Race
Ancestry
AfghanAfricanAlaska NativeAlaskan AthabascanAlbanianAleutAlsatianAmericanApacheArabArapahoArgentineanArmenianAssyrian/Chaldean/SyriacAustralianAustrianBahamianBangladeshiBarbadianBasqueBelgianBelizeanBermudanBhutaneseBlackfeetBolivianBrazilianBritishBritish West IndianBulgarianBurmeseCajunCambodianCanadianCape VerdeanCarpatho RusynCelticCentral AmericanCentral American IndianCherokeeCheyenneChickasawChileanChineseChippewaChoctawColombianColvilleComancheCosta RicanCreeCreekCroatianCrowCubanCypriotCzechCzechoslovakianDanishDelawareDominicanDutchDutch West IndianEastern EuropeanEcuadorianEgyptianEnglishEstonianEthiopianEuropeanFijianFilipinoFinnishFrenchFrench American IndianFrench CanadianGermanGerman RussianGhanaianGreekGuamanian/ChamorroGuatemalanGuyaneseHaitianHmongHonduranHopiHoumaHungarianIcelanderIndian (Asian)IndonesianInupiatIranianIraqiIrishIroquoisIsraeliItalianJamaicanJapaneseJordanianKenyanKiowaKoreanLaotianLatvianLebaneseLiberianLithuanianLumbeeLuxembourgerMacedonianMalaysianMalteseMarshalleseMenomineeMexicanMexican American IndianMongolianMoroccanNative HawaiianNavajoNepaleseNew ZealanderNicaraguanNigerianNorthern EuropeanNorwegianOkinawanOsageOttawaPaiutePakistaniPalestinianPanamanianParaguayanPennsylvania GermanPeruvianPimaPolishPortuguesePotawatomiPuebloPuerto RicanPuget Sound SalishRomanianRussianSalvadoranSamoanScandinavianScotch-IrishScottishSeminoleSenegaleseSerbianShoshoneSierra LeoneanSiouxSlavicSlovakSloveneSomaliSouth AfricanSouth AmericanSouth American IndianSoviet UnionSpaniardSpanishSpanish AmericanSpanish American IndianSri LankanSubsaharan AfricanSudaneseSwedishSwissSyrianTaiwaneseThaiTlingit-HaidaTohono O'OdhamTonganTrinidadian and TobagonianTsimshianTurkishU.S. Virgin IslanderUgandanUkrainianUruguayanUteVenezuelanVietnameseWelshWest IndianYakamaYaquiYugoslavianYumanYup'ikZimbabwean
Immigration
NonimmigrantsImmigrantsAfghanistanAfricaAlbaniaArgentinaArmeniaAsiaAustraliaAustriaBahamasBangladeshBarbadosBelarusBelgiumBelizeBoliviaBosnia and HerzegovinaBrazilBulgariaBurma/MyanmarCabo VerdeCambodiaCameroonCanadaCaribbeanCentral AmericaChileChinaColombiaCongoCosta RicaCroatiaCubaCzechoslovakiaDenmarkDominicaDominican RepublicEastern AfricaEastern AsiaEastern EuropeEcuadorEgyptEl SalvadorEnglandEritreaEthiopiaEuropeFijiFranceGermanyGhanaGreeceGrenadaGuatemalaGuyanaHaitiHondurasHong KongHungaryIndiaIndonesiaIranIraqIrelandIsraelItalyJamaicaJapanJordanKazakhstanKenyaKoreaKuwaitLaosLatin AmericaLatviaLebanonLiberiaLithuaniaMalaysiaMexicoMicronesiaMiddle AfricaMoldovaMoroccoNepalNetherlandsNicaraguaNigeriaNorth AmericaNorth MacedoniaNorthern AfricaNorthern EuropeNorwayOceaniaPakistanPanamaPeruPhilippinesPolandPortugalRomaniaRussiaSaudi ArabiaScotlandSenegalSerbiaSierra LeoneSingaporeSomaliaSouth AfricaSouth AmericaSouth Central AsiaSouth Eastern AsiaSouthern EuropeSpainSri LankaSt. Vincent and the GrenadinesSudanSwedenSwitzerlandSyriaTaiwanThailandTrinidad and TobagoTurkeyUgandaUkraineUruguayUzbekistanVenezuelaVietnamWest IndiesWestern AfricaWestern AsiaYemenZaireZimbabweAzores
Immigrants from Western Europe
Race
Ancestry
AfghanAfricanAlaska NativeAlaskan AthabascanAlbanianAleutAlsatianAmericanApacheArabArapahoArgentineanArmenianAssyrian/Chaldean/SyriacAustralianAustrianBahamianBangladeshiBarbadianBasqueBelgianBelizeanBermudanBhutaneseBlackfeetBolivianBrazilianBritishBritish West IndianBulgarianBurmeseCajunCambodianCanadianCape VerdeanCarpatho RusynCelticCentral AmericanCentral American IndianCherokeeCheyenneChickasawChileanChineseChippewaChoctawColombianColvilleComancheCosta RicanCreeCreekCroatianCrowCubanCypriotCzechCzechoslovakianDanishDelawareDominicanDutchDutch West IndianEastern EuropeanEcuadorianEgyptianEnglishEstonianEthiopianEuropeanFijianFilipinoFinnishFrenchFrench American IndianFrench CanadianGermanGerman RussianGhanaianGreekGuamanian/ChamorroGuatemalanGuyaneseHaitianHmongHonduranHopiHoumaHungarianIcelanderIndian (Asian)IndonesianInupiatIranianIraqiIrishIroquoisIsraeliItalianJamaicanJapaneseJordanianKenyanKiowaKoreanLaotianLatvianLebaneseLiberianLithuanianLumbeeLuxembourgerMacedonianMalaysianMalteseMarshalleseMenomineeMexicanMexican American IndianMongolianMoroccanNative HawaiianNavajoNepaleseNew ZealanderNicaraguanNigerianNorthern EuropeanNorwegianOkinawanOsageOttawaPaiutePakistaniPalestinianPanamanianParaguayanPennsylvania GermanPeruvianPimaPolishPortuguesePotawatomiPuebloPuerto RicanPuget Sound SalishRomanianRussianSalvadoranSamoanScandinavianScotch-IrishScottishSeminoleSenegaleseSerbianShoshoneSierra LeoneanSiouxSlavicSlovakSloveneSomaliSouth AfricanSouth AmericanSouth American IndianSoviet UnionSpaniardSpanishSpanish AmericanSpanish American IndianSri LankanSubsaharan AfricanSudaneseSwedishSwissSyrianTaiwaneseThaiTlingit-HaidaTohono O'OdhamTonganTrinidadian and TobagonianTsimshianTurkishU.S. Virgin IslanderUgandanUkrainianUruguayanUteVenezuelanVietnameseWelshWest IndianYakamaYaquiYugoslavianYumanYup'ikZimbabwean
Immigration
NonimmigrantsImmigrantsAfghanistanAfricaAlbaniaArgentinaArmeniaAsiaAustraliaAustriaBahamasBangladeshBarbadosBelarusBelgiumBelizeBoliviaBosnia and HerzegovinaBrazilBulgariaBurma/MyanmarCabo VerdeCambodiaCameroonCanadaCaribbeanCentral AmericaChileChinaCongoCosta RicaCroatiaCubaCzechoslovakiaDenmarkDominicaDominican RepublicEastern AfricaEastern AsiaEastern EuropeEcuadorEgyptEl SalvadorEnglandEritreaEthiopiaEuropeFijiFranceGermanyGhanaGreeceGrenadaGuatemalaGuyanaHaitiHondurasHong KongHungaryIndiaIndonesiaIranIraqIrelandIsraelItalyJamaicaJapanJordanKazakhstanKenyaKoreaKuwaitLaosLatin AmericaLatviaLebanonLiberiaLithuaniaMalaysiaMexicoMicronesiaMiddle AfricaMoldovaMoroccoNepalNetherlandsNicaraguaNigeriaNorth AmericaNorth MacedoniaNorthern AfricaNorthern EuropeNorwayOceaniaPakistanPanamaPeruPhilippinesPolandPortugalRomaniaRussiaSaudi ArabiaScotlandSenegalSerbiaSierra LeoneSingaporeSomaliaSouth AfricaSouth AmericaSouth Central AsiaSouth Eastern AsiaSouthern EuropeSpainSri LankaSt. Vincent and the GrenadinesSudanSwedenSwitzerlandSyriaTaiwanThailandTrinidad and TobagoTurkeyUgandaUkraineUruguayUzbekistanVenezuelaVietnamWest IndiesWestern AfricaWestern AsiaWestern EuropeYemenZaireZimbabweAzores
Unemployment Among Ages 35 to 44 years
Income
Poverty
Unemployment
Labor Participation
Family Structure
Vehicle Availability
Education Level
Disability

Unemployment Among Ages 35 to 44 years Comparison

Immigrants from Colombia

Immigrants from Western Europe

Excellent
Good
4.6%
UNEMPLOYMENT AMONG AGES 35 TO 44 YEARS
82.6/ 100
METRIC RATING
131st/ 347
METRIC RANK
4.6%
UNEMPLOYMENT AMONG AGES 35 TO 44 YEARS
65.5/ 100
METRIC RATING
154th/ 347
METRIC RANK

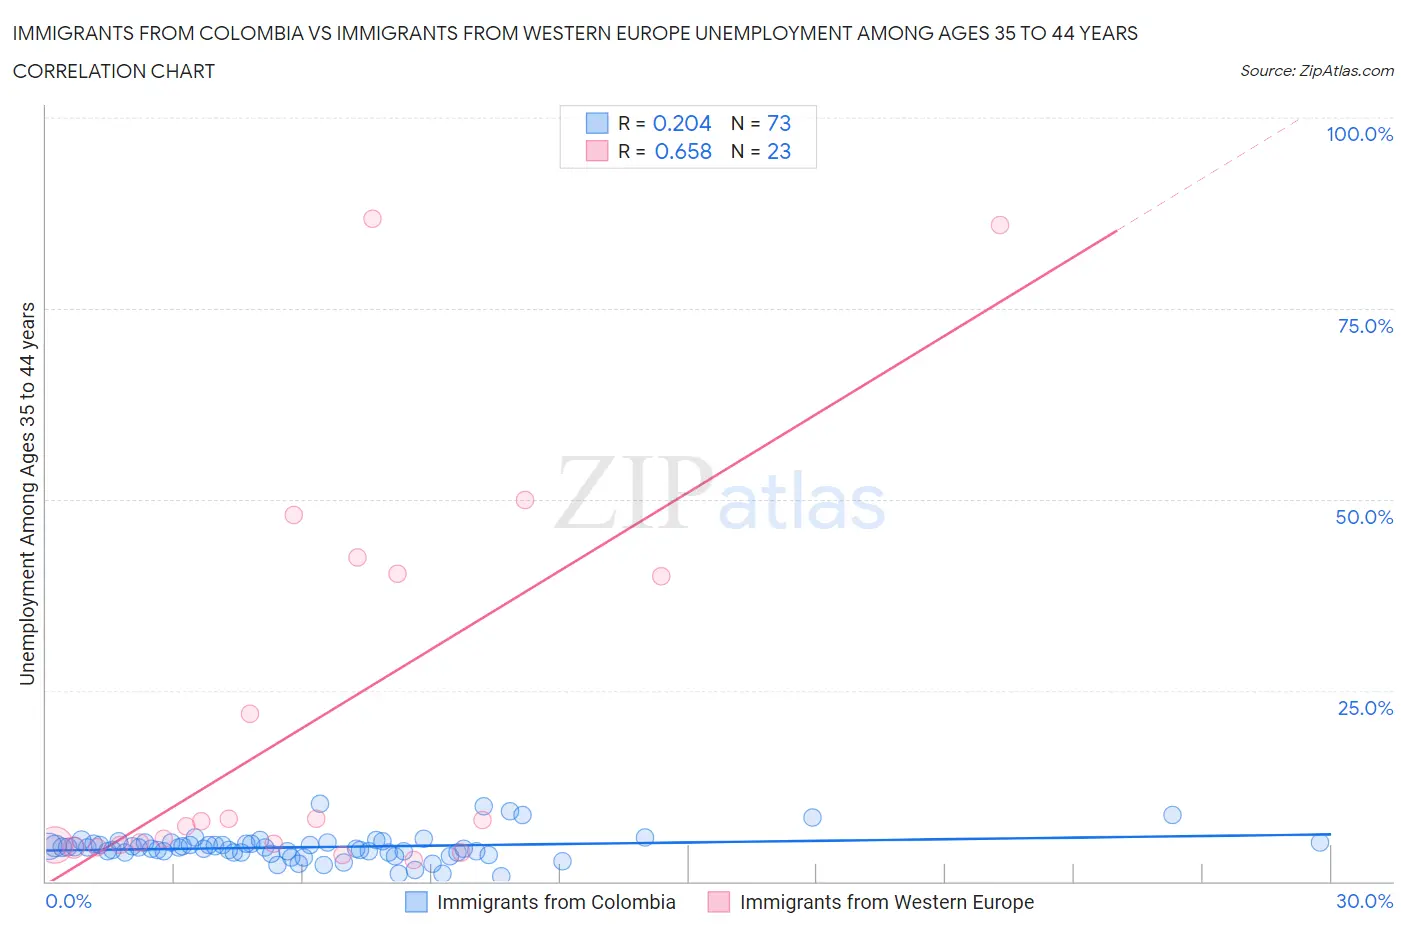
Immigrants from Colombia vs Immigrants from Western Europe Unemployment Among Ages 35 to 44 years Correlation Chart

The statistical analysis conducted on geographies consisting of 371,726,560 people shows a weak positive correlation between the proportion of Immigrants from Colombia and unemployment rate among population between the ages 35 and 44 in the United States with a correlation coefficient (R) of 0.204 and weighted average of 4.6%. Similarly, the statistical analysis conducted on geographies consisting of 474,568,404 people shows a significant positive correlation between the proportion of Immigrants from Western Europe and unemployment rate among population between the ages 35 and 44 in the United States with a correlation coefficient (R) of 0.658 and weighted average of 4.6%, a difference of 1.7%.
Immigrants from Colombia vs Immigrants from Western Europe Unemployment Among Ages 35 to 44 years

Unemployment Among Ages 35 to 44 years Correlation Summary

MeasurementImmigrants from ColombiaImmigrants from Western Europe
Minimum0.71%2.8%
Maximum10.1%86.8%
Range9.4%84.0%
Mean4.5%21.7%
Median4.4%7.8%
Interquartile 25% (IQ1)3.8%4.7%
Interquartile 75% (IQ3)5.0%40.2%
Interquartile Range (IQR)1.2%35.5%
Standard Deviation (Sample)1.8%26.0%
Standard Deviation (Population)1.8%25.5%

Similar Demographics by Unemployment Among Ages 35 to 44 years

Demographics Similar to Immigrants from Colombia by Unemployment Among Ages 35 to 44 years

In terms of unemployment among ages 35 to 44 years, the demographic groups most similar to Immigrants from Colombia are Immigrants from Eritrea (4.6%, a difference of 0.020%), Immigrants from Croatia (4.6%, a difference of 0.060%), Czechoslovakian (4.6%, a difference of 0.10%), Colombian (4.6%, a difference of 0.22%), and Syrian (4.6%, a difference of 0.24%).
DemographicsRating | RankUnemployment Among Ages 35 to 44 years
Immigrants | Spain
86.1
/100
|
#124
Excellent
4.5%
Immigrants | Northern Africa
86.1
/100
|
#125
Excellent
4.5%
Immigrants | Austria
84.7
/100
|
#126
Excellent
4.5%
Immigrants | Ethiopia
84.7
/100
|
#127
Excellent
4.5%
Czechoslovakians
83.4
/100
|
#128
Excellent
4.6%
Immigrants | Croatia
83.1
/100
|
#129
Excellent
4.6%
Immigrants | Eritrea
82.8
/100
|
#130
Excellent
4.6%
Immigrants | Colombia
82.6
/100
|
#131
Excellent
4.6%
Colombians
80.8
/100
|
#132
Excellent
4.6%
Syrians
80.7
/100
|
#133
Excellent
4.6%
Laotians
80.1
/100
|
#134
Excellent
4.6%
Immigrants | Europe
79.4
/100
|
#135
Good
4.6%
Scotch-Irish
79.3
/100
|
#136
Good
4.6%
Immigrants | Iraq
78.9
/100
|
#137
Good
4.6%
Immigrants | Norway
77.5
/100
|
#138
Good
4.6%

Demographics Similar to Immigrants from Western Europe by Unemployment Among Ages 35 to 44 years

In terms of unemployment among ages 35 to 44 years, the demographic groups most similar to Immigrants from Western Europe are White/Caucasian (4.6%, a difference of 0.050%), Immigrants from Brazil (4.6%, a difference of 0.12%), Puget Sound Salish (4.6%, a difference of 0.13%), Pakistani (4.6%, a difference of 0.13%), and South American (4.6%, a difference of 0.14%).
DemographicsRating | RankUnemployment Among Ages 35 to 44 years
Immigrants | Vietnam
73.8
/100
|
#147
Good
4.6%
Slavs
72.4
/100
|
#148
Good
4.6%
Immigrants | Burma/Myanmar
72.2
/100
|
#149
Good
4.6%
Immigrants | England
70.5
/100
|
#150
Good
4.6%
Puget Sound Salish
67.1
/100
|
#151
Good
4.6%
Pakistanis
67.1
/100
|
#152
Good
4.6%
Immigrants | Brazil
67.0
/100
|
#153
Good
4.6%
Immigrants | Western Europe
65.5
/100
|
#154
Good
4.6%
Whites/Caucasians
64.9
/100
|
#155
Good
4.6%
South Americans
63.7
/100
|
#156
Good
4.6%
Immigrants | Belarus
63.4
/100
|
#157
Good
4.6%
Immigrants | Iran
63.1
/100
|
#158
Good
4.6%
Albanians
63.0
/100
|
#159
Good
4.6%
Hungarians
62.6
/100
|
#160
Good
4.6%
Celtics
61.7
/100
|
#161
Good
4.7%