Immigrants from Colombia vs Immigrants from Liberia Unemployment Among Ages 16 to 19 years
COMPARE
Immigrants from Colombia
Immigrants from Liberia
Unemployment Among Ages 16 to 19 years
Unemployment Among Ages 16 to 19 years Comparison
Immigrants from Colombia
Immigrants from Liberia
18.3%
UNEMPLOYMENT AMONG AGES 16 TO 19 YEARS
2.7/ 100
METRIC RATING
236th/ 347
METRIC RANK
18.1%
UNEMPLOYMENT AMONG AGES 16 TO 19 YEARS
7.1/ 100
METRIC RATING
227th/ 347
METRIC RANK
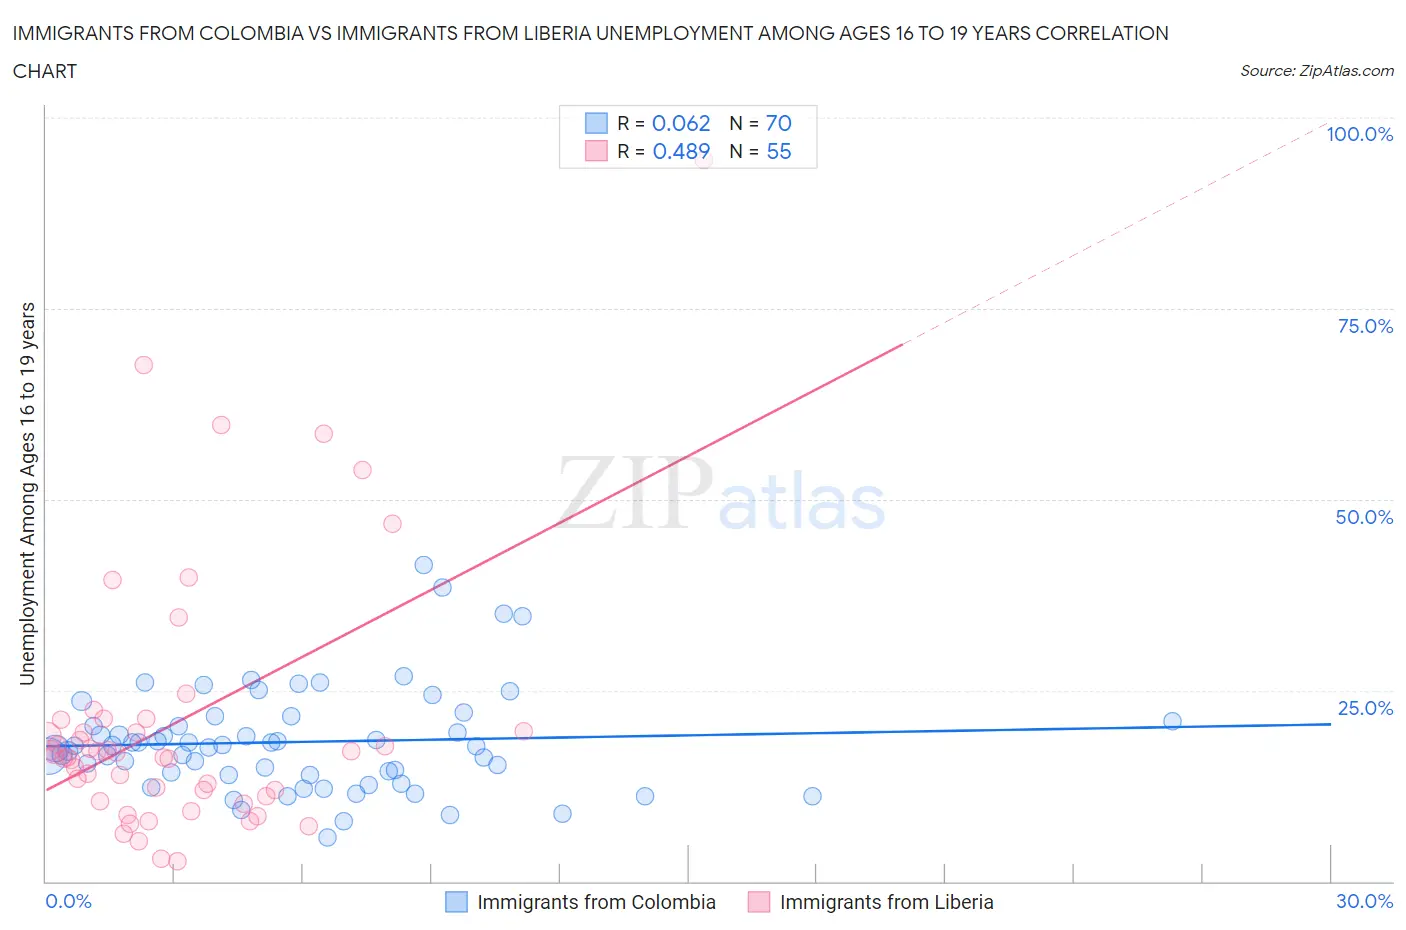
Immigrants from Colombia vs Immigrants from Liberia Unemployment Among Ages 16 to 19 years Correlation Chart
The statistical analysis conducted on geographies consisting of 360,806,237 people shows a slight positive correlation between the proportion of Immigrants from Colombia and unemployment rate among population between the ages 16 and 19 in the United States with a correlation coefficient (R) of 0.062 and weighted average of 18.3%. Similarly, the statistical analysis conducted on geographies consisting of 133,284,598 people shows a moderate positive correlation between the proportion of Immigrants from Liberia and unemployment rate among population between the ages 16 and 19 in the United States with a correlation coefficient (R) of 0.489 and weighted average of 18.1%, a difference of 1.2%.
Unemployment Among Ages 16 to 19 years Correlation Summary
| Measurement | Immigrants from Colombia | Immigrants from Liberia |
| Minimum | 5.8% | 2.6% |
| Maximum | 41.3% | 94.4% |
| Range | 35.6% | 91.8% |
| Mean | 18.2% | 20.9% |
| Median | 17.7% | 16.6% |
| Interquartile 25% (IQ1) | 13.9% | 11.2% |
| Interquartile 75% (IQ3) | 20.9% | 21.1% |
| Interquartile Range (IQR) | 7.0% | 9.9% |
| Standard Deviation (Sample) | 6.8% | 17.5% |
| Standard Deviation (Population) | 6.8% | 17.3% |
Demographics Similar to Immigrants from Colombia and Immigrants from Liberia by Unemployment Among Ages 16 to 19 years
In terms of unemployment among ages 16 to 19 years, the demographic groups most similar to Immigrants from Colombia are Immigrants (18.3%, a difference of 0.020%), South American (18.3%, a difference of 0.030%), French American Indian (18.3%, a difference of 0.070%), Native Hawaiian (18.3%, a difference of 0.11%), and Immigrants from Cabo Verde (18.4%, a difference of 0.33%). Similarly, the demographic groups most similar to Immigrants from Liberia are Immigrants from Greece (18.1%, a difference of 0.010%), Immigrants from Belgium (18.1%, a difference of 0.020%), Immigrants from Chile (18.1%, a difference of 0.060%), Immigrants from Serbia (18.1%, a difference of 0.18%), and Albanian (18.2%, a difference of 0.26%).
| Demographics | Rating | Rank | Unemployment Among Ages 16 to 19 years |
| Immigrants | Spain | 11.4 /100 | #221 | Poor 18.0% |
| Immigrants | Iran | 10.7 /100 | #222 | Poor 18.0% |
| Immigrants | Western Asia | 10.2 /100 | #223 | Poor 18.0% |
| Immigrants | Serbia | 8.3 /100 | #224 | Tragic 18.1% |
| Immigrants | Chile | 7.5 /100 | #225 | Tragic 18.1% |
| Immigrants | Belgium | 7.3 /100 | #226 | Tragic 18.1% |
| Immigrants | Liberia | 7.1 /100 | #227 | Tragic 18.1% |
| Immigrants | Greece | 7.1 /100 | #228 | Tragic 18.1% |
| Albanians | 5.8 /100 | #229 | Tragic 18.2% |
| Spanish Americans | 4.7 /100 | #230 | Tragic 18.2% |
| Nepalese | 4.2 /100 | #231 | Tragic 18.2% |
| Immigrants | Russia | 4.0 /100 | #232 | Tragic 18.2% |
| Seminole | 4.0 /100 | #233 | Tragic 18.2% |
| Colombians | 3.7 /100 | #234 | Tragic 18.3% |
| French American Indians | 2.9 /100 | #235 | Tragic 18.3% |
| Immigrants | Colombia | 2.7 /100 | #236 | Tragic 18.3% |
| Immigrants | Immigrants | 2.7 /100 | #237 | Tragic 18.3% |
| South Americans | 2.6 /100 | #238 | Tragic 18.3% |
| Native Hawaiians | 2.4 /100 | #239 | Tragic 18.3% |
| Immigrants | Cabo Verde | 2.0 /100 | #240 | Tragic 18.4% |
| Immigrants | Ukraine | 1.3 /100 | #241 | Tragic 18.5% |