Immigrants from Colombia vs Immigrants from Eastern Europe Unemployment Among Ages 30 to 34 years
COMPARE
Immigrants from Colombia
Immigrants from Eastern Europe
Unemployment Among Ages 30 to 34 years
Unemployment Among Ages 30 to 34 years Comparison
Immigrants from Colombia
Immigrants from Eastern Europe
5.4%
UNEMPLOYMENT AMONG AGES 30 TO 34 YEARS
68.9/ 100
METRIC RATING
149th/ 347
METRIC RANK
5.3%
UNEMPLOYMENT AMONG AGES 30 TO 34 YEARS
77.4/ 100
METRIC RATING
131st/ 347
METRIC RANK
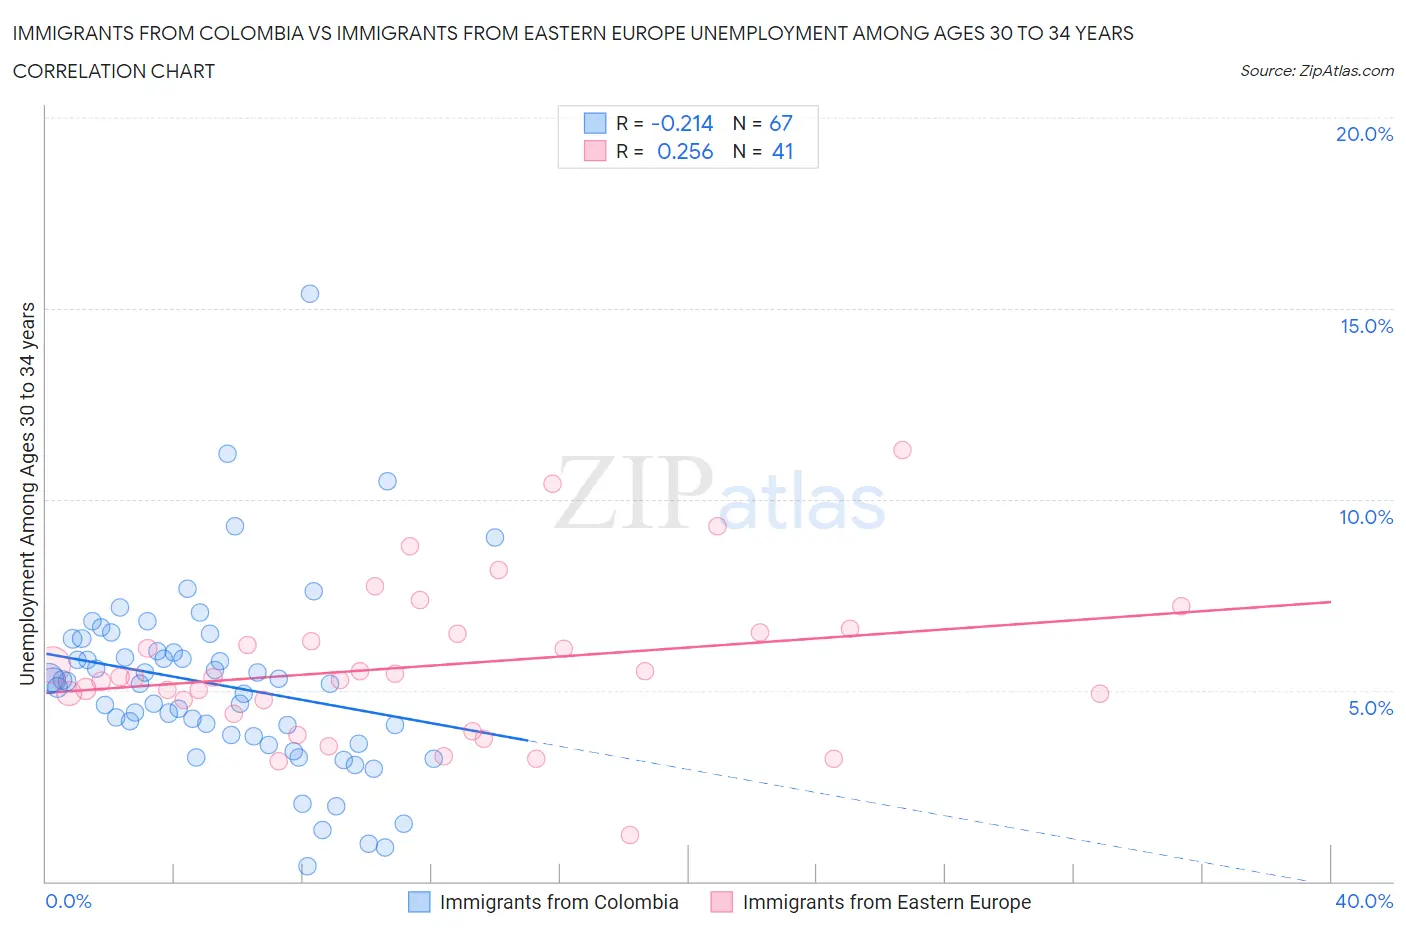
Immigrants from Colombia vs Immigrants from Eastern Europe Unemployment Among Ages 30 to 34 years Correlation Chart
The statistical analysis conducted on geographies consisting of 359,255,220 people shows a weak negative correlation between the proportion of Immigrants from Colombia and unemployment rate among population between the ages 30 and 34 in the United States with a correlation coefficient (R) of -0.214 and weighted average of 5.4%. Similarly, the statistical analysis conducted on geographies consisting of 436,944,798 people shows a weak positive correlation between the proportion of Immigrants from Eastern Europe and unemployment rate among population between the ages 30 and 34 in the United States with a correlation coefficient (R) of 0.256 and weighted average of 5.3%, a difference of 0.77%.
Unemployment Among Ages 30 to 34 years Correlation Summary
| Measurement | Immigrants from Colombia | Immigrants from Eastern Europe |
| Minimum | 0.40% | 1.2% |
| Maximum | 15.4% | 11.3% |
| Range | 15.0% | 10.1% |
| Mean | 5.1% | 5.6% |
| Median | 5.2% | 5.3% |
| Interquartile 25% (IQ1) | 3.8% | 4.6% |
| Interquartile 75% (IQ3) | 6.0% | 6.5% |
| Interquartile Range (IQR) | 2.2% | 1.9% |
| Standard Deviation (Sample) | 2.4% | 2.0% |
| Standard Deviation (Population) | 2.4% | 2.0% |
Demographics Similar to Immigrants from Colombia and Immigrants from Eastern Europe by Unemployment Among Ages 30 to 34 years
In terms of unemployment among ages 30 to 34 years, the demographic groups most similar to Immigrants from Colombia are Colombian (5.4%, a difference of 0.010%), Immigrants from Iran (5.4%, a difference of 0.020%), Ukrainian (5.4%, a difference of 0.030%), Celtic (5.4%, a difference of 0.11%), and Syrian (5.4%, a difference of 0.12%). Similarly, the demographic groups most similar to Immigrants from Eastern Europe are Carpatho Rusyn (5.3%, a difference of 0.010%), Immigrants from Northern Europe (5.3%, a difference of 0.010%), German (5.3%, a difference of 0.040%), Bangladeshi (5.3%, a difference of 0.080%), and Palestinian (5.4%, a difference of 0.22%).
| Demographics | Rating | Rank | Unemployment Among Ages 30 to 34 years |
| Germans | 77.8 /100 | #130 | Good 5.3% |
| Immigrants | Eastern Europe | 77.4 /100 | #131 | Good 5.3% |
| Carpatho Rusyns | 77.3 /100 | #132 | Good 5.3% |
| Immigrants | Northern Europe | 77.3 /100 | #133 | Good 5.3% |
| Bangladeshis | 76.6 /100 | #134 | Good 5.3% |
| Palestinians | 75.1 /100 | #135 | Good 5.4% |
| Pakistanis | 74.6 /100 | #136 | Good 5.4% |
| Immigrants | Canada | 74.6 /100 | #137 | Good 5.4% |
| Serbians | 72.9 /100 | #138 | Good 5.4% |
| Lithuanians | 72.4 /100 | #139 | Good 5.4% |
| Immigrants | North America | 72.2 /100 | #140 | Good 5.4% |
| Immigrants | Europe | 72.1 /100 | #141 | Good 5.4% |
| Immigrants | Greece | 72.0 /100 | #142 | Good 5.4% |
| Russians | 71.1 /100 | #143 | Good 5.4% |
| Immigrants | Russia | 71.0 /100 | #144 | Good 5.4% |
| Syrians | 70.3 /100 | #145 | Good 5.4% |
| Celtics | 70.2 /100 | #146 | Good 5.4% |
| Ukrainians | 69.2 /100 | #147 | Good 5.4% |
| Immigrants | Iran | 69.1 /100 | #148 | Good 5.4% |
| Immigrants | Colombia | 68.9 /100 | #149 | Good 5.4% |
| Colombians | 68.7 /100 | #150 | Good 5.4% |