Immigrants from Chile vs Sri Lankan Unemployment Among Ages 30 to 34 years
COMPARE
Immigrants from Chile
Sri Lankan
Unemployment Among Ages 30 to 34 years
Unemployment Among Ages 30 to 34 years Comparison
Immigrants from Chile
Sri Lankans
5.3%
UNEMPLOYMENT AMONG AGES 30 TO 34 YEARS
86.7/ 100
METRIC RATING
109th/ 347
METRIC RANK
5.0%
UNEMPLOYMENT AMONG AGES 30 TO 34 YEARS
99.0/ 100
METRIC RATING
38th/ 347
METRIC RANK
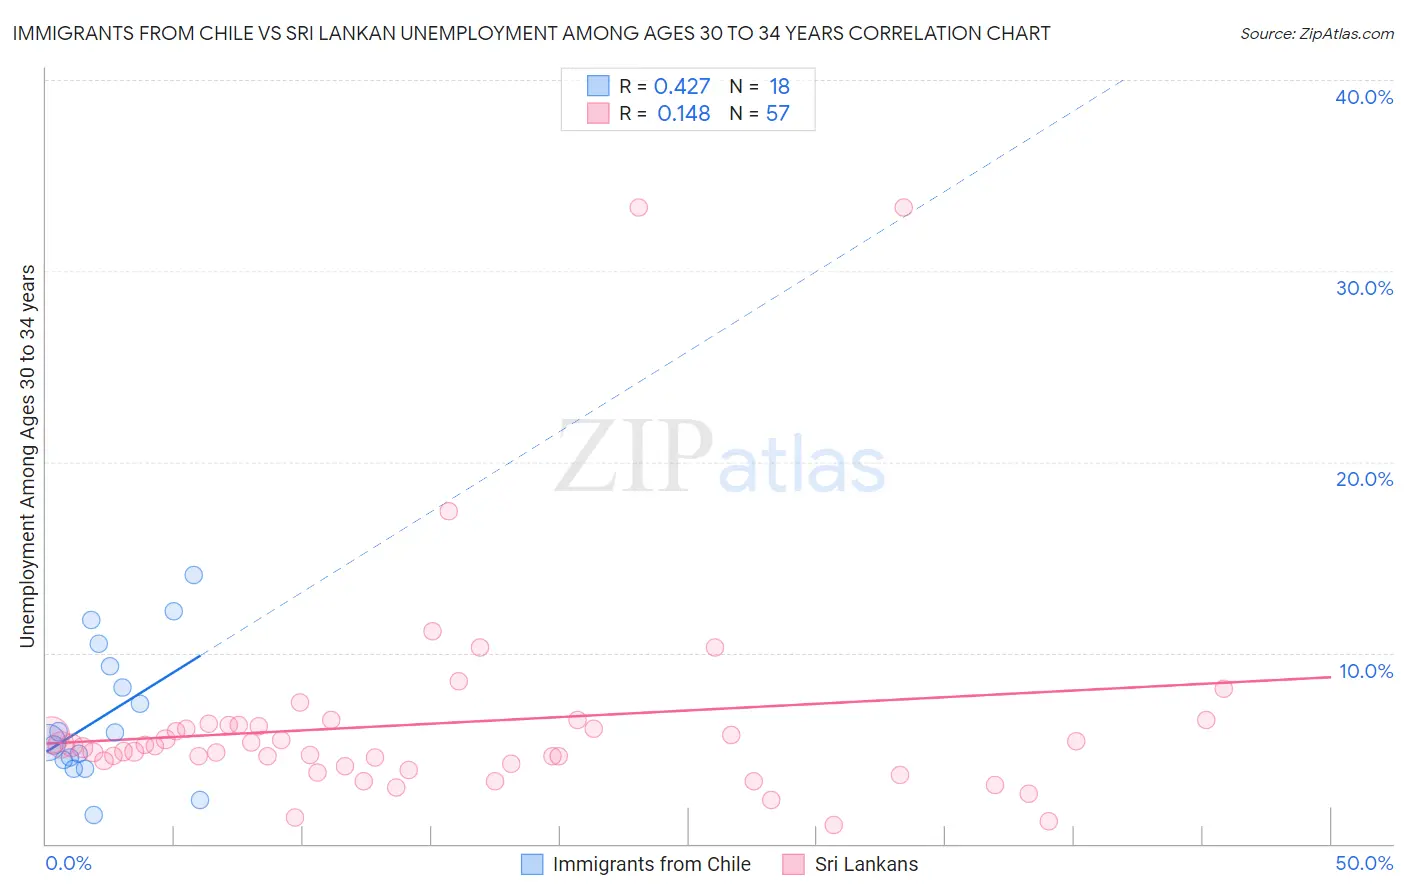
Immigrants from Chile vs Sri Lankan Unemployment Among Ages 30 to 34 years Correlation Chart
The statistical analysis conducted on geographies consisting of 212,636,811 people shows a moderate positive correlation between the proportion of Immigrants from Chile and unemployment rate among population between the ages 30 and 34 in the United States with a correlation coefficient (R) of 0.427 and weighted average of 5.3%. Similarly, the statistical analysis conducted on geographies consisting of 413,546,912 people shows a poor positive correlation between the proportion of Sri Lankans and unemployment rate among population between the ages 30 and 34 in the United States with a correlation coefficient (R) of 0.148 and weighted average of 5.0%, a difference of 5.2%.
Unemployment Among Ages 30 to 34 years Correlation Summary
| Measurement | Immigrants from Chile | Sri Lankan |
| Minimum | 1.5% | 1.0% |
| Maximum | 14.1% | 33.3% |
| Range | 12.6% | 32.3% |
| Mean | 6.7% | 6.3% |
| Median | 5.6% | 5.1% |
| Interquartile 25% (IQ1) | 4.4% | 4.1% |
| Interquartile 75% (IQ3) | 9.3% | 6.2% |
| Interquartile Range (IQR) | 4.9% | 2.1% |
| Standard Deviation (Sample) | 3.6% | 5.8% |
| Standard Deviation (Population) | 3.5% | 5.7% |
Similar Demographics by Unemployment Among Ages 30 to 34 years
Demographics Similar to Immigrants from Chile by Unemployment Among Ages 30 to 34 years
In terms of unemployment among ages 30 to 34 years, the demographic groups most similar to Immigrants from Chile are Egyptian (5.3%, a difference of 0.050%), Immigrants from Middle Africa (5.3%, a difference of 0.060%), Icelander (5.3%, a difference of 0.070%), Immigrants from Pakistan (5.3%, a difference of 0.070%), and Swiss (5.3%, a difference of 0.12%).
| Demographics | Rating | Rank | Unemployment Among Ages 30 to 34 years |
| Immigrants | Switzerland | 88.8 /100 | #102 | Excellent 5.3% |
| Immigrants | Jordan | 88.8 /100 | #103 | Excellent 5.3% |
| Northern Europeans | 87.9 /100 | #104 | Excellent 5.3% |
| Argentineans | 87.9 /100 | #105 | Excellent 5.3% |
| Croatians | 87.6 /100 | #106 | Excellent 5.3% |
| Icelanders | 87.2 /100 | #107 | Excellent 5.3% |
| Immigrants | Middle Africa | 87.1 /100 | #108 | Excellent 5.3% |
| Immigrants | Chile | 86.7 /100 | #109 | Excellent 5.3% |
| Egyptians | 86.4 /100 | #110 | Excellent 5.3% |
| Immigrants | Pakistan | 86.2 /100 | #111 | Excellent 5.3% |
| Swiss | 85.9 /100 | #112 | Excellent 5.3% |
| Immigrants | Spain | 85.6 /100 | #113 | Excellent 5.3% |
| Estonians | 83.7 /100 | #114 | Excellent 5.3% |
| Immigrants | Albania | 83.4 /100 | #115 | Excellent 5.3% |
| Eastern Europeans | 83.2 /100 | #116 | Excellent 5.3% |
Demographics Similar to Sri Lankans by Unemployment Among Ages 30 to 34 years
In terms of unemployment among ages 30 to 34 years, the demographic groups most similar to Sri Lankans are Immigrants from Turkey (5.0%, a difference of 0.0%), Fijian (5.0%, a difference of 0.10%), Immigrants from Vietnam (5.0%, a difference of 0.18%), Immigrants from Eastern Africa (5.0%, a difference of 0.19%), and Czech (5.0%, a difference of 0.25%).
| Demographics | Rating | Rank | Unemployment Among Ages 30 to 34 years |
| Somalis | 99.3 /100 | #31 | Exceptional 5.0% |
| Immigrants | Zaire | 99.3 /100 | #32 | Exceptional 5.0% |
| Immigrants | Saudi Arabia | 99.3 /100 | #33 | Exceptional 5.0% |
| Latvians | 99.3 /100 | #34 | Exceptional 5.0% |
| Immigrants | Ethiopia | 99.2 /100 | #35 | Exceptional 5.0% |
| Czechs | 99.2 /100 | #36 | Exceptional 5.0% |
| Immigrants | Turkey | 99.0 /100 | #37 | Exceptional 5.0% |
| Sri Lankans | 99.0 /100 | #38 | Exceptional 5.0% |
| Fijians | 99.0 /100 | #39 | Exceptional 5.0% |
| Immigrants | Vietnam | 98.9 /100 | #40 | Exceptional 5.0% |
| Immigrants | Eastern Africa | 98.9 /100 | #41 | Exceptional 5.0% |
| Immigrants | Hong Kong | 98.8 /100 | #42 | Exceptional 5.0% |
| Soviet Union | 98.8 /100 | #43 | Exceptional 5.0% |
| Immigrants | Belgium | 98.7 /100 | #44 | Exceptional 5.1% |
| Yugoslavians | 98.6 /100 | #45 | Exceptional 5.1% |