Immigrants from Chile vs Immigrants from Jordan Unemployment Among Women with Children Under 6 years
COMPARE
Immigrants from Chile
Immigrants from Jordan
Unemployment Among Women with Children Under 6 years
Unemployment Among Women with Children Under 6 years Comparison
Immigrants from Chile
Immigrants from Jordan
7.3%
UNEMPLOYMENT AMONG WOMEN WITH CHILDREN UNDER 6 YEARS
93.5/ 100
METRIC RATING
121st/ 347
METRIC RANK
7.5%
UNEMPLOYMENT AMONG WOMEN WITH CHILDREN UNDER 6 YEARS
78.9/ 100
METRIC RATING
145th/ 347
METRIC RANK
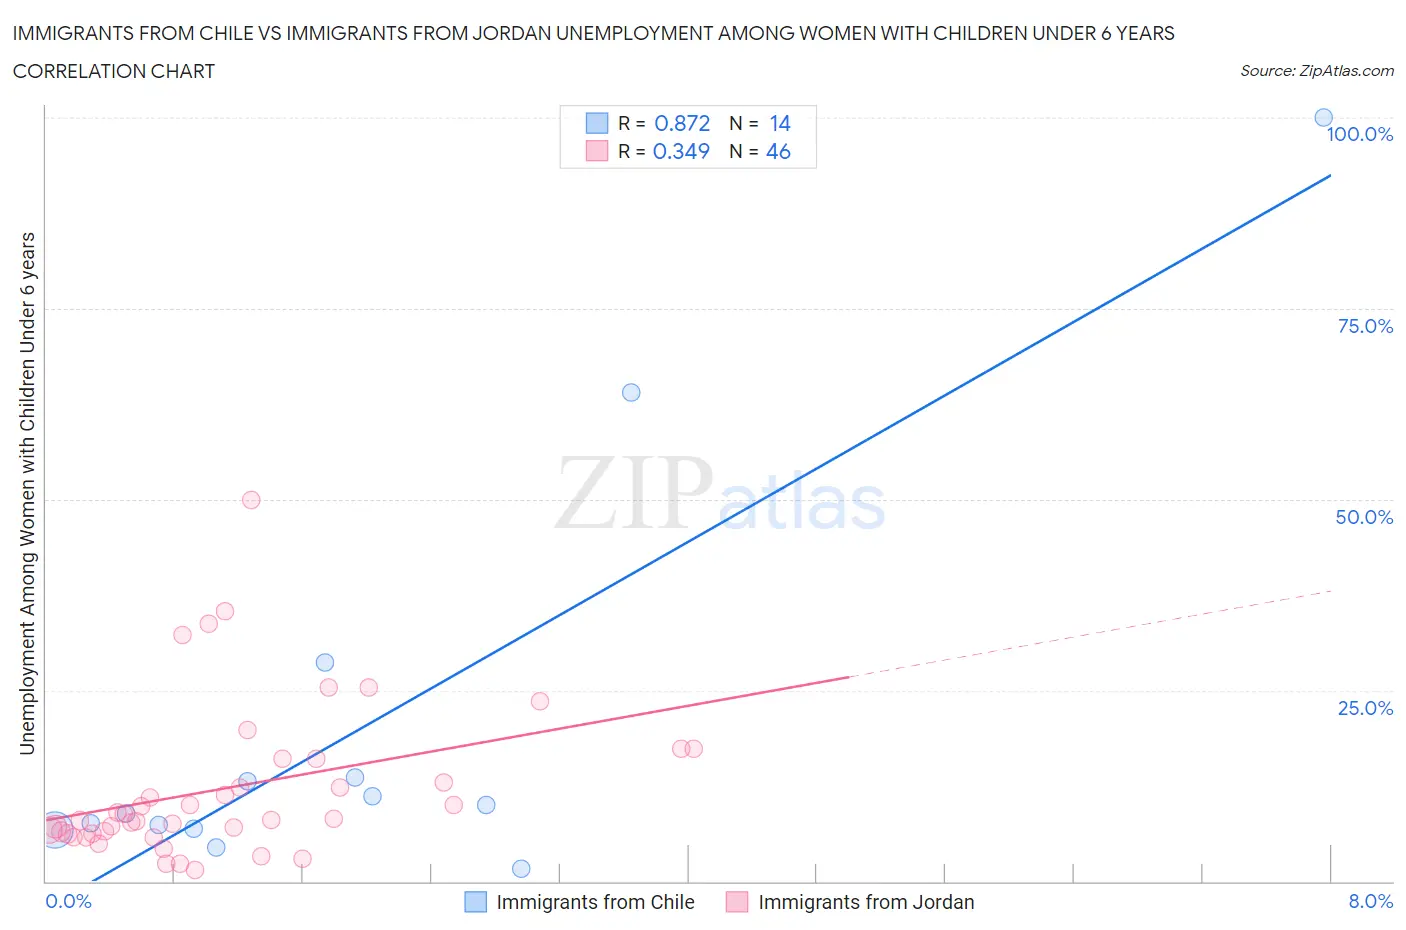
Immigrants from Chile vs Immigrants from Jordan Unemployment Among Women with Children Under 6 years Correlation Chart
The statistical analysis conducted on geographies consisting of 184,982,304 people shows a very strong positive correlation between the proportion of Immigrants from Chile and unemployment rate among women with children under the age of 6 in the United States with a correlation coefficient (R) of 0.872 and weighted average of 7.3%. Similarly, the statistical analysis conducted on geographies consisting of 157,070,333 people shows a mild positive correlation between the proportion of Immigrants from Jordan and unemployment rate among women with children under the age of 6 in the United States with a correlation coefficient (R) of 0.349 and weighted average of 7.5%, a difference of 2.3%.
Unemployment Among Women with Children Under 6 years Correlation Summary
| Measurement | Immigrants from Chile | Immigrants from Jordan |
| Minimum | 1.6% | 1.5% |
| Maximum | 100.0% | 50.0% |
| Range | 98.4% | 48.5% |
| Mean | 20.3% | 12.2% |
| Median | 9.4% | 8.2% |
| Interquartile 25% (IQ1) | 6.9% | 6.3% |
| Interquartile 75% (IQ3) | 13.6% | 16.0% |
| Interquartile Range (IQR) | 6.7% | 9.7% |
| Standard Deviation (Sample) | 27.8% | 10.1% |
| Standard Deviation (Population) | 26.8% | 9.9% |
Similar Demographics by Unemployment Among Women with Children Under 6 years
Demographics Similar to Immigrants from Chile by Unemployment Among Women with Children Under 6 years
In terms of unemployment among women with children under 6 years, the demographic groups most similar to Immigrants from Chile are Immigrants from Bosnia and Herzegovina (7.3%, a difference of 0.010%), Immigrants from Zaire (7.3%, a difference of 0.060%), Iraqi (7.3%, a difference of 0.12%), South African (7.3%, a difference of 0.19%), and Immigrants from South Africa (7.3%, a difference of 0.26%).
| Demographics | Rating | Rank | Unemployment Among Women with Children Under 6 years |
| Argentineans | 96.2 /100 | #114 | Exceptional 7.2% |
| Immigrants | Italy | 96.1 /100 | #115 | Exceptional 7.2% |
| Armenians | 95.9 /100 | #116 | Exceptional 7.2% |
| Immigrants | Kenya | 95.4 /100 | #117 | Exceptional 7.3% |
| Serbians | 94.5 /100 | #118 | Exceptional 7.3% |
| South Africans | 94.1 /100 | #119 | Exceptional 7.3% |
| Iraqis | 93.9 /100 | #120 | Exceptional 7.3% |
| Immigrants | Chile | 93.5 /100 | #121 | Exceptional 7.3% |
| Immigrants | Bosnia and Herzegovina | 93.5 /100 | #122 | Exceptional 7.3% |
| Immigrants | Zaire | 93.3 /100 | #123 | Exceptional 7.3% |
| Immigrants | South Africa | 92.5 /100 | #124 | Exceptional 7.3% |
| Pakistanis | 92.2 /100 | #125 | Exceptional 7.3% |
| Immigrants | Burma/Myanmar | 91.9 /100 | #126 | Exceptional 7.3% |
| Jordanians | 91.5 /100 | #127 | Exceptional 7.3% |
| Zimbabweans | 91.5 /100 | #128 | Exceptional 7.3% |
Demographics Similar to Immigrants from Jordan by Unemployment Among Women with Children Under 6 years
In terms of unemployment among women with children under 6 years, the demographic groups most similar to Immigrants from Jordan are Japanese (7.5%, a difference of 0.0%), European (7.5%, a difference of 0.030%), Immigrants from Oceania (7.5%, a difference of 0.050%), Immigrants from Brazil (7.5%, a difference of 0.16%), and Korean (7.5%, a difference of 0.26%).
| Demographics | Rating | Rank | Unemployment Among Women with Children Under 6 years |
| Immigrants | Norway | 84.1 /100 | #138 | Excellent 7.4% |
| Immigrants | Colombia | 83.9 /100 | #139 | Excellent 7.4% |
| Scandinavians | 83.0 /100 | #140 | Excellent 7.4% |
| Greeks | 82.6 /100 | #141 | Excellent 7.4% |
| Immigrants | Argentina | 81.5 /100 | #142 | Excellent 7.5% |
| Koreans | 81.3 /100 | #143 | Excellent 7.5% |
| Europeans | 79.1 /100 | #144 | Good 7.5% |
| Immigrants | Jordan | 78.9 /100 | #145 | Good 7.5% |
| Japanese | 78.9 /100 | #146 | Good 7.5% |
| Immigrants | Oceania | 78.4 /100 | #147 | Good 7.5% |
| Immigrants | Brazil | 77.3 /100 | #148 | Good 7.5% |
| Colombians | 76.1 /100 | #149 | Good 7.5% |
| Aleuts | 76.0 /100 | #150 | Good 7.5% |
| Immigrants | Peru | 74.9 /100 | #151 | Good 7.5% |
| Bangladeshis | 74.8 /100 | #152 | Good 7.5% |