Immigrants from Central America vs Israeli Female Unemployment
COMPARE
Immigrants from Central America
Israeli
Female Unemployment
Female Unemployment Comparison
Immigrants from Central America
Israelis
6.2%
FEMALE UNEMPLOYMENT
0.0/ 100
METRIC RATING
306th/ 347
METRIC RANK
5.5%
FEMALE UNEMPLOYMENT
4.8/ 100
METRIC RATING
228th/ 347
METRIC RANK
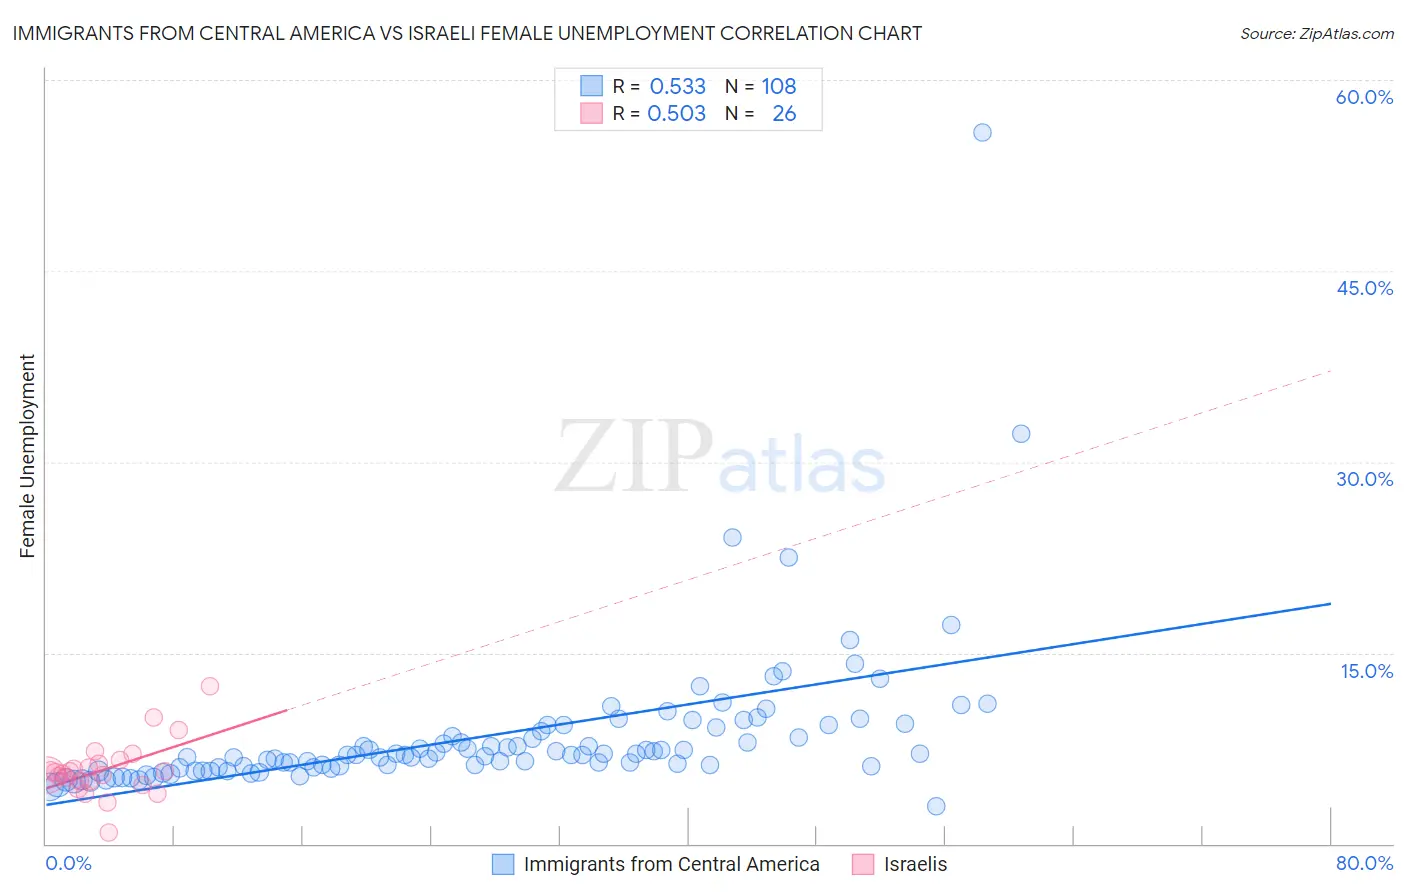
Immigrants from Central America vs Israeli Female Unemployment Correlation Chart
The statistical analysis conducted on geographies consisting of 528,420,242 people shows a substantial positive correlation between the proportion of Immigrants from Central America and unemploymnet rate among females in the United States with a correlation coefficient (R) of 0.533 and weighted average of 6.2%. Similarly, the statistical analysis conducted on geographies consisting of 210,819,653 people shows a substantial positive correlation between the proportion of Israelis and unemploymnet rate among females in the United States with a correlation coefficient (R) of 0.503 and weighted average of 5.5%, a difference of 13.3%.
Female Unemployment Correlation Summary
| Measurement | Immigrants from Central America | Israeli |
| Minimum | 2.9% | 0.90% |
| Maximum | 55.9% | 12.4% |
| Range | 53.0% | 11.5% |
| Mean | 8.5% | 5.8% |
| Median | 7.0% | 5.6% |
| Interquartile 25% (IQ1) | 6.0% | 4.9% |
| Interquartile 75% (IQ3) | 9.0% | 6.3% |
| Interquartile Range (IQR) | 3.0% | 1.4% |
| Standard Deviation (Sample) | 6.1% | 2.2% |
| Standard Deviation (Population) | 6.1% | 2.1% |
Similar Demographics by Female Unemployment
Demographics Similar to Immigrants from Central America by Female Unemployment
In terms of female unemployment, the demographic groups most similar to Immigrants from Central America are Shoshone (6.2%, a difference of 0.010%), Hispanic or Latino (6.2%, a difference of 0.070%), Spanish American Indian (6.2%, a difference of 0.16%), Immigrants from Jamaica (6.2%, a difference of 0.21%), and Barbadian (6.2%, a difference of 0.58%).
| Demographics | Rating | Rank | Female Unemployment |
| Ute | 0.0 /100 | #299 | Tragic 6.1% |
| Immigrants | Haiti | 0.0 /100 | #300 | Tragic 6.1% |
| Immigrants | Barbados | 0.0 /100 | #301 | Tragic 6.2% |
| U.S. Virgin Islanders | 0.0 /100 | #302 | Tragic 6.2% |
| Barbadians | 0.0 /100 | #303 | Tragic 6.2% |
| Immigrants | Jamaica | 0.0 /100 | #304 | Tragic 6.2% |
| Spanish American Indians | 0.0 /100 | #305 | Tragic 6.2% |
| Immigrants | Central America | 0.0 /100 | #306 | Tragic 6.2% |
| Shoshone | 0.0 /100 | #307 | Tragic 6.2% |
| Hispanics or Latinos | 0.0 /100 | #308 | Tragic 6.2% |
| Ecuadorians | 0.0 /100 | #309 | Tragic 6.3% |
| Central American Indians | 0.0 /100 | #310 | Tragic 6.3% |
| Immigrants | Mexico | 0.0 /100 | #311 | Tragic 6.3% |
| Immigrants | Grenada | 0.0 /100 | #312 | Tragic 6.3% |
| Belizeans | 0.0 /100 | #313 | Tragic 6.3% |
Demographics Similar to Israelis by Female Unemployment
In terms of female unemployment, the demographic groups most similar to Israelis are Panamanian (5.5%, a difference of 0.010%), Immigrants from Uruguay (5.5%, a difference of 0.020%), Immigrants from Philippines (5.5%, a difference of 0.16%), Immigrants from Iraq (5.5%, a difference of 0.30%), and Liberian (5.5%, a difference of 0.30%).
| Demographics | Rating | Rank | Female Unemployment |
| Brazilians | 7.3 /100 | #221 | Tragic 5.5% |
| Nicaraguans | 7.2 /100 | #222 | Tragic 5.5% |
| Delaware | 7.2 /100 | #223 | Tragic 5.5% |
| Iraqis | 7.1 /100 | #224 | Tragic 5.5% |
| French American Indians | 6.1 /100 | #225 | Tragic 5.5% |
| Immigrants | Peru | 5.9 /100 | #226 | Tragic 5.5% |
| Immigrants | Philippines | 5.3 /100 | #227 | Tragic 5.5% |
| Israelis | 4.8 /100 | #228 | Tragic 5.5% |
| Panamanians | 4.7 /100 | #229 | Tragic 5.5% |
| Immigrants | Uruguay | 4.7 /100 | #230 | Tragic 5.5% |
| Immigrants | Iraq | 3.9 /100 | #231 | Tragic 5.5% |
| Liberians | 3.9 /100 | #232 | Tragic 5.5% |
| Moroccans | 3.4 /100 | #233 | Tragic 5.5% |
| Immigrants | Lebanon | 3.3 /100 | #234 | Tragic 5.5% |
| Immigrants | Iran | 3.3 /100 | #235 | Tragic 5.5% |