Immigrants from Central America vs Immigrants from Canada Unemployment Among Ages 35 to 44 years

COMPARE

Immigrants from Central America
Race
Ancestry
AfghanAfricanAlaska NativeAlaskan AthabascanAlbanianAleutAlsatianAmericanApacheArabArapahoArgentineanArmenianAssyrian/Chaldean/SyriacAustralianAustrianBahamianBangladeshiBarbadianBasqueBelgianBelizeanBermudanBhutaneseBlackfeetBolivianBrazilianBritishBritish West IndianBulgarianBurmeseCajunCambodianCanadianCape VerdeanCarpatho RusynCelticCentral AmericanCentral American IndianCherokeeCheyenneChickasawChileanChineseChippewaChoctawColombianColvilleComancheCosta RicanCreeCreekCroatianCrowCubanCypriotCzechCzechoslovakianDanishDelawareDominicanDutchDutch West IndianEastern EuropeanEcuadorianEgyptianEnglishEstonianEthiopianEuropeanFijianFilipinoFinnishFrenchFrench American IndianFrench CanadianGermanGerman RussianGhanaianGreekGuamanian/ChamorroGuatemalanGuyaneseHaitianHmongHonduranHopiHoumaHungarianIcelanderIndian (Asian)IndonesianInupiatIranianIraqiIrishIroquoisIsraeliItalianJamaicanJapaneseJordanianKenyanKiowaKoreanLaotianLatvianLebaneseLiberianLithuanianLumbeeLuxembourgerMacedonianMalaysianMalteseMarshalleseMenomineeMexicanMexican American IndianMongolianMoroccanNative HawaiianNavajoNepaleseNew ZealanderNicaraguanNigerianNorthern EuropeanNorwegianOkinawanOsageOttawaPaiutePakistaniPalestinianPanamanianParaguayanPennsylvania GermanPeruvianPimaPolishPortuguesePotawatomiPuebloPuerto RicanPuget Sound SalishRomanianRussianSalvadoranSamoanScandinavianScotch-IrishScottishSeminoleSenegaleseSerbianShoshoneSierra LeoneanSiouxSlavicSlovakSloveneSomaliSouth AfricanSouth AmericanSouth American IndianSoviet UnionSpaniardSpanishSpanish AmericanSpanish American IndianSri LankanSubsaharan AfricanSudaneseSwedishSwissSyrianTaiwaneseThaiTlingit-HaidaTohono O'OdhamTonganTrinidadian and TobagonianTsimshianTurkishU.S. Virgin IslanderUgandanUkrainianUruguayanUteVenezuelanVietnameseWelshWest IndianYakamaYaquiYugoslavianYumanYup'ikZimbabwean
Immigration
NonimmigrantsImmigrantsAfghanistanAfricaAlbaniaArgentinaArmeniaAsiaAustraliaAustriaBahamasBangladeshBarbadosBelarusBelgiumBelizeBoliviaBosnia and HerzegovinaBrazilBulgariaBurma/MyanmarCabo VerdeCambodiaCameroonCaribbeanCentral AmericaChileChinaColombiaCongoCosta RicaCroatiaCubaCzechoslovakiaDenmarkDominicaDominican RepublicEastern AfricaEastern AsiaEastern EuropeEcuadorEgyptEl SalvadorEnglandEritreaEthiopiaEuropeFijiFranceGermanyGhanaGreeceGrenadaGuatemalaGuyanaHaitiHondurasHong KongHungaryIndiaIndonesiaIranIraqIrelandIsraelItalyJamaicaJapanJordanKazakhstanKenyaKoreaKuwaitLaosLatin AmericaLatviaLebanonLiberiaLithuaniaMalaysiaMexicoMicronesiaMiddle AfricaMoldovaMoroccoNepalNetherlandsNicaraguaNigeriaNorth AmericaNorth MacedoniaNorthern AfricaNorthern EuropeNorwayOceaniaPakistanPanamaPeruPhilippinesPolandPortugalRomaniaRussiaSaudi ArabiaScotlandSenegalSerbiaSierra LeoneSingaporeSomaliaSouth AfricaSouth AmericaSouth Central AsiaSouth Eastern AsiaSouthern EuropeSpainSri LankaSt. Vincent and the GrenadinesSudanSwedenSwitzerlandSyriaTaiwanThailandTrinidad and TobagoTurkeyUgandaUkraineUruguayUzbekistanVenezuelaVietnamWest IndiesWestern AfricaWestern AsiaWestern EuropeYemenZaireZimbabweAzores
Immigrants from Canada
Race
Ancestry
AfghanAfricanAlaska NativeAlaskan AthabascanAlbanianAleutAlsatianAmericanApacheArabArapahoArgentineanArmenianAssyrian/Chaldean/SyriacAustralianAustrianBahamianBangladeshiBarbadianBasqueBelgianBelizeanBermudanBhutaneseBlackfeetBolivianBrazilianBritishBritish West IndianBulgarianBurmeseCajunCambodianCanadianCape VerdeanCarpatho RusynCelticCentral AmericanCentral American IndianCherokeeCheyenneChickasawChileanChineseChippewaChoctawColombianColvilleComancheCosta RicanCreeCreekCroatianCrowCubanCypriotCzechCzechoslovakianDanishDelawareDominicanDutchDutch West IndianEastern EuropeanEcuadorianEgyptianEnglishEstonianEthiopianEuropeanFijianFilipinoFinnishFrenchFrench American IndianFrench CanadianGermanGerman RussianGhanaianGreekGuamanian/ChamorroGuatemalanGuyaneseHaitianHmongHonduranHopiHoumaHungarianIcelanderIndian (Asian)IndonesianInupiatIranianIraqiIrishIroquoisIsraeliItalianJamaicanJapaneseJordanianKenyanKiowaKoreanLaotianLatvianLebaneseLiberianLithuanianLumbeeLuxembourgerMacedonianMalaysianMalteseMarshalleseMenomineeMexicanMexican American IndianMongolianMoroccanNative HawaiianNavajoNepaleseNew ZealanderNicaraguanNigerianNorthern EuropeanNorwegianOkinawanOsageOttawaPaiutePakistaniPalestinianPanamanianParaguayanPennsylvania GermanPeruvianPimaPolishPortuguesePotawatomiPuebloPuerto RicanPuget Sound SalishRomanianRussianSalvadoranSamoanScandinavianScotch-IrishScottishSeminoleSenegaleseSerbianShoshoneSierra LeoneanSiouxSlavicSlovakSloveneSomaliSouth AfricanSouth AmericanSouth American IndianSoviet UnionSpaniardSpanishSpanish AmericanSpanish American IndianSri LankanSubsaharan AfricanSudaneseSwedishSwissSyrianTaiwaneseThaiTlingit-HaidaTohono O'OdhamTonganTrinidadian and TobagonianTsimshianTurkishU.S. Virgin IslanderUgandanUkrainianUruguayanUteVenezuelanVietnameseWelshWest IndianYakamaYaquiYugoslavianYumanYup'ikZimbabwean
Immigration
NonimmigrantsImmigrantsAfghanistanAfricaAlbaniaArgentinaArmeniaAsiaAustraliaAustriaBahamasBangladeshBarbadosBelarusBelgiumBelizeBoliviaBosnia and HerzegovinaBrazilBulgariaBurma/MyanmarCabo VerdeCambodiaCameroonCanadaCaribbeanChileChinaColombiaCongoCosta RicaCroatiaCubaCzechoslovakiaDenmarkDominicaDominican RepublicEastern AfricaEastern AsiaEastern EuropeEcuadorEgyptEl SalvadorEnglandEritreaEthiopiaEuropeFijiFranceGermanyGhanaGreeceGrenadaGuatemalaGuyanaHaitiHondurasHong KongHungaryIndiaIndonesiaIranIraqIrelandIsraelItalyJamaicaJapanJordanKazakhstanKenyaKoreaKuwaitLaosLatin AmericaLatviaLebanonLiberiaLithuaniaMalaysiaMexicoMicronesiaMiddle AfricaMoldovaMoroccoNepalNetherlandsNicaraguaNigeriaNorth AmericaNorth MacedoniaNorthern AfricaNorthern EuropeNorwayOceaniaPakistanPanamaPeruPhilippinesPolandPortugalRomaniaRussiaSaudi ArabiaScotlandSenegalSerbiaSierra LeoneSingaporeSomaliaSouth AfricaSouth AmericaSouth Central AsiaSouth Eastern AsiaSouthern EuropeSpainSri LankaSt. Vincent and the GrenadinesSudanSwedenSwitzerlandSyriaTaiwanThailandTrinidad and TobagoTurkeyUgandaUkraineUruguayUzbekistanVenezuelaVietnamWest IndiesWestern AfricaWestern AsiaWestern EuropeYemenZaireZimbabweAzores
Unemployment Among Ages 35 to 44 years
Income
Poverty
Unemployment
Labor Participation
Family Structure
Vehicle Availability
Education Level
Disability

Unemployment Among Ages 35 to 44 years Comparison

Immigrants from Central America

Immigrants from Canada

Tragic
Exceptional
5.3%
UNEMPLOYMENT AMONG AGES 35 TO 44 YEARS
0.1/ 100
METRIC RATING
262nd/ 347
METRIC RANK
4.5%
UNEMPLOYMENT AMONG AGES 35 TO 44 YEARS
92.3/ 100
METRIC RATING
98th/ 347
METRIC RANK

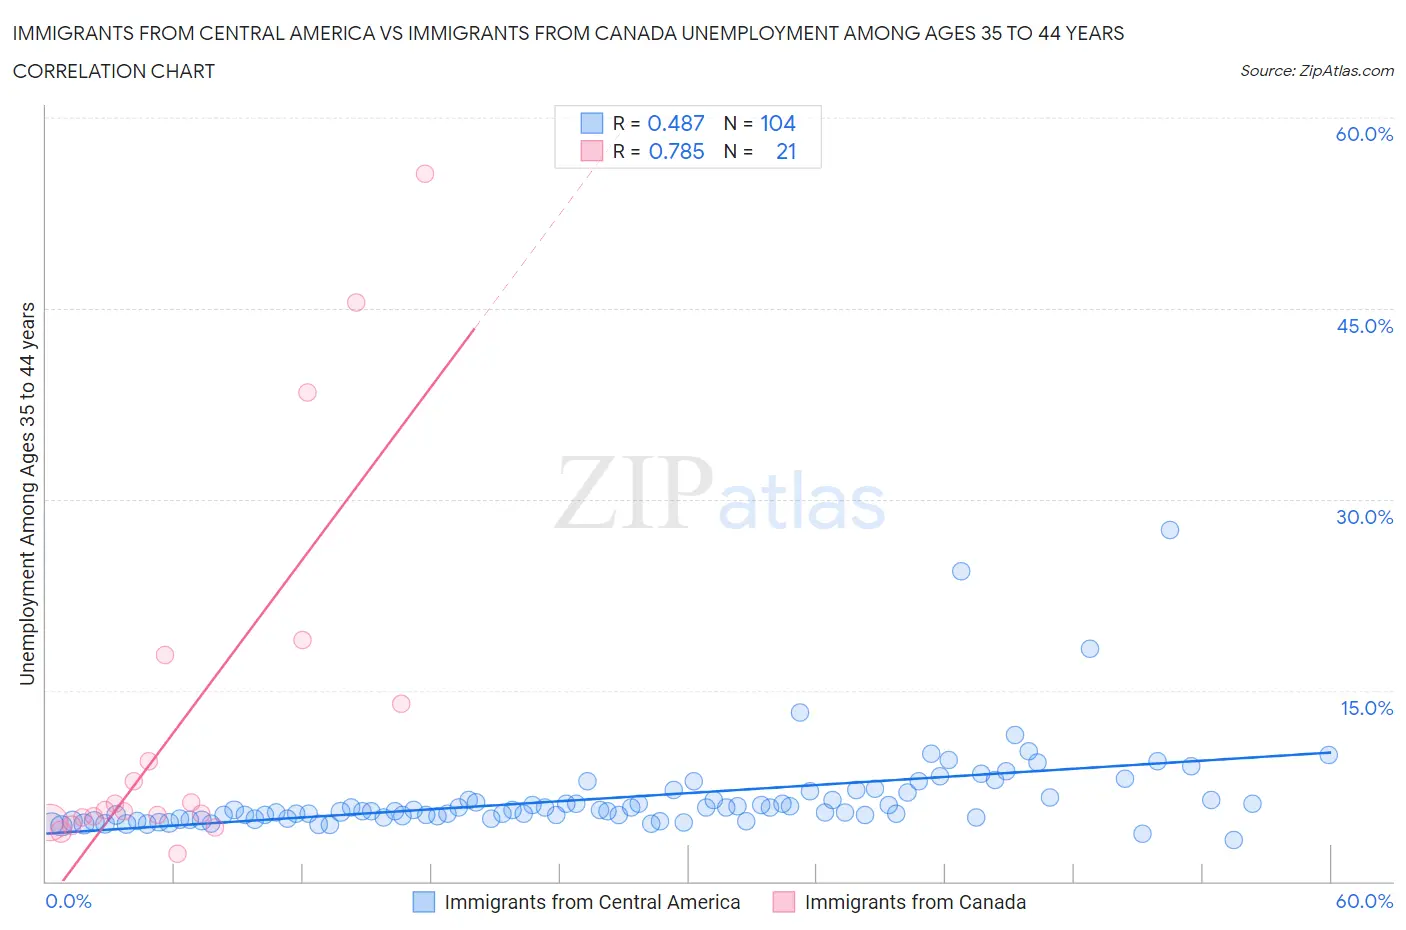
Immigrants from Central America vs Immigrants from Canada Unemployment Among Ages 35 to 44 years Correlation Chart

The statistical analysis conducted on geographies consisting of 509,941,869 people shows a moderate positive correlation between the proportion of Immigrants from Central America and unemployment rate among population between the ages 35 and 44 in the United States with a correlation coefficient (R) of 0.487 and weighted average of 5.3%. Similarly, the statistical analysis conducted on geographies consisting of 443,343,768 people shows a strong positive correlation between the proportion of Immigrants from Canada and unemployment rate among population between the ages 35 and 44 in the United States with a correlation coefficient (R) of 0.785 and weighted average of 4.5%, a difference of 18.3%.
Immigrants from Central America vs Immigrants from Canada Unemployment Among Ages 35 to 44 years

Unemployment Among Ages 35 to 44 years Correlation Summary

MeasurementImmigrants from Central AmericaImmigrants from Canada
Minimum3.2%2.2%
Maximum27.6%55.6%
Range24.4%53.4%
Mean6.5%12.9%
Median5.6%5.6%
Interquartile 25% (IQ1)5.0%4.8%
Interquartile 75% (IQ3)6.5%15.9%
Interquartile Range (IQR)1.5%11.0%
Standard Deviation (Sample)3.4%15.0%
Standard Deviation (Population)3.4%14.6%

Similar Demographics by Unemployment Among Ages 35 to 44 years

Demographics Similar to Immigrants from Central America by Unemployment Among Ages 35 to 44 years

In terms of unemployment among ages 35 to 44 years, the demographic groups most similar to Immigrants from Central America are Choctaw (5.3%, a difference of 0.070%), Ghanaian (5.3%, a difference of 0.070%), Yaqui (5.3%, a difference of 0.27%), Immigrants from Bangladesh (5.3%, a difference of 0.28%), and Immigrants from Western Africa (5.3%, a difference of 0.41%).
DemographicsRating | RankUnemployment Among Ages 35 to 44 years
Cherokee
0.2
/100
|
#255
Tragic
5.2%
Seminole
0.1
/100
|
#256
Tragic
5.2%
Immigrants | Fiji
0.1
/100
|
#257
Tragic
5.3%
Immigrants | Latin America
0.1
/100
|
#258
Tragic
5.3%
Mexicans
0.1
/100
|
#259
Tragic
5.3%
Sub-Saharan Africans
0.1
/100
|
#260
Tragic
5.3%
Spanish Americans
0.1
/100
|
#261
Tragic
5.3%
Immigrants | Central America
0.1
/100
|
#262
Tragic
5.3%
Choctaw
0.1
/100
|
#263
Tragic
5.3%
Ghanaians
0.1
/100
|
#264
Tragic
5.3%
Yaqui
0.1
/100
|
#265
Tragic
5.3%
Immigrants | Bangladesh
0.1
/100
|
#266
Tragic
5.3%
Immigrants | Western Africa
0.0
/100
|
#267
Tragic
5.3%
Hawaiians
0.0
/100
|
#268
Tragic
5.3%
Cajuns
0.0
/100
|
#269
Tragic
5.3%

Demographics Similar to Immigrants from Canada by Unemployment Among Ages 35 to 44 years

In terms of unemployment among ages 35 to 44 years, the demographic groups most similar to Immigrants from Canada are Immigrants from Egypt (4.5%, a difference of 0.010%), Immigrants from France (4.5%, a difference of 0.050%), Italian (4.5%, a difference of 0.10%), Immigrants from Netherlands (4.5%, a difference of 0.11%), and Immigrants from Sudan (4.5%, a difference of 0.14%).
DemographicsRating | RankUnemployment Among Ages 35 to 44 years
Immigrants | Northern Europe
94.3
/100
|
#91
Exceptional
4.5%
Estonians
94.3
/100
|
#92
Exceptional
4.5%
Iranians
93.9
/100
|
#93
Exceptional
4.5%
Russians
93.8
/100
|
#94
Exceptional
4.5%
Yugoslavians
93.6
/100
|
#95
Exceptional
4.5%
Scottish
93.5
/100
|
#96
Exceptional
4.5%
Immigrants | France
92.5
/100
|
#97
Exceptional
4.5%
Immigrants | Canada
92.3
/100
|
#98
Exceptional
4.5%
Immigrants | Egypt
92.3
/100
|
#99
Exceptional
4.5%
Italians
91.9
/100
|
#100
Exceptional
4.5%
Immigrants | Netherlands
91.9
/100
|
#101
Exceptional
4.5%
Immigrants | Sudan
91.8
/100
|
#102
Exceptional
4.5%
Welsh
91.6
/100
|
#103
Exceptional
4.5%
Finns
91.6
/100
|
#104
Exceptional
4.5%
Immigrants | Saudi Arabia
91.3
/100
|
#105
Exceptional
4.5%