Immigrants from Central America vs Danish Unemployment
COMPARE
Immigrants from Central America
Danish
Unemployment
Unemployment Comparison
Immigrants from Central America
Danes
6.0%
UNEMPLOYMENT
0.0/ 100
METRIC RATING
276th/ 347
METRIC RANK
4.3%
UNEMPLOYMENT
100.0/ 100
METRIC RATING
4th/ 347
METRIC RANK
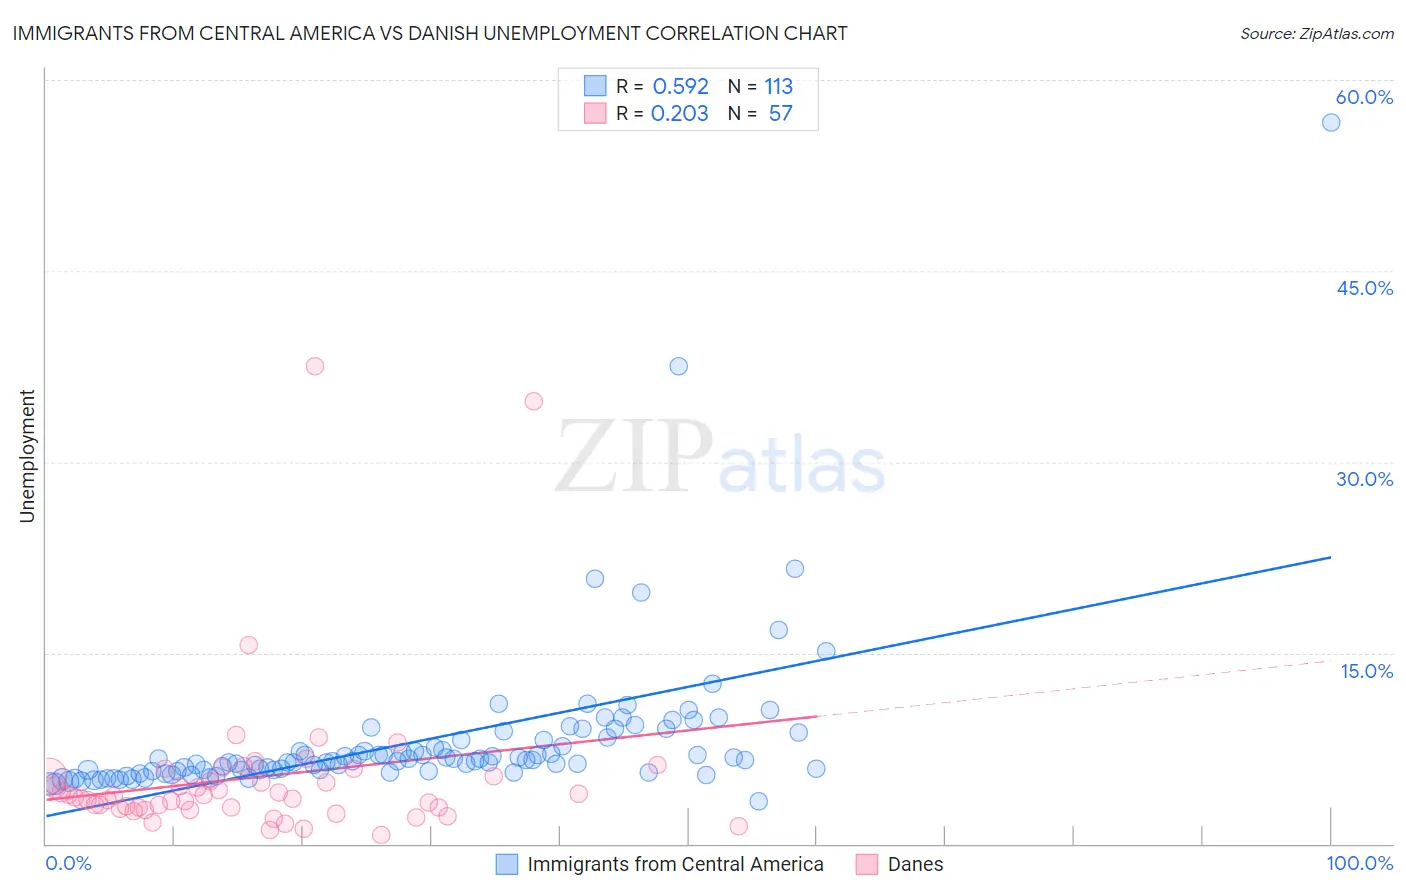
Immigrants from Central America vs Danish Unemployment Correlation Chart
The statistical analysis conducted on geographies consisting of 534,368,587 people shows a substantial positive correlation between the proportion of Immigrants from Central America and unemployment in the United States with a correlation coefficient (R) of 0.592 and weighted average of 6.0%. Similarly, the statistical analysis conducted on geographies consisting of 472,550,686 people shows a weak positive correlation between the proportion of Danes and unemployment in the United States with a correlation coefficient (R) of 0.203 and weighted average of 4.3%, a difference of 36.9%.
Unemployment Correlation Summary
| Measurement | Immigrants from Central America | Danish |
| Minimum | 3.3% | 0.70% |
| Maximum | 56.6% | 37.5% |
| Range | 53.3% | 36.8% |
| Mean | 8.1% | 5.2% |
| Median | 6.5% | 3.6% |
| Interquartile 25% (IQ1) | 5.7% | 2.8% |
| Interquartile 75% (IQ3) | 8.1% | 5.3% |
| Interquartile Range (IQR) | 2.4% | 2.5% |
| Standard Deviation (Sample) | 6.2% | 6.4% |
| Standard Deviation (Population) | 6.2% | 6.3% |
Similar Demographics by Unemployment
Demographics Similar to Immigrants from Central America by Unemployment
In terms of unemployment, the demographic groups most similar to Immigrants from Central America are Immigrants from Latin America (5.9%, a difference of 0.28%), Armenian (6.0%, a difference of 0.35%), Bahamian (5.9%, a difference of 0.49%), Ghanaian (6.0%, a difference of 0.64%), and Immigrants from Fiji (5.9%, a difference of 0.78%).
| Demographics | Rating | Rank | Unemployment |
| Immigrants | El Salvador | 0.1 /100 | #269 | Tragic 5.8% |
| Blackfeet | 0.1 /100 | #270 | Tragic 5.8% |
| Mexicans | 0.1 /100 | #271 | Tragic 5.9% |
| Hispanics or Latinos | 0.0 /100 | #272 | Tragic 5.9% |
| Immigrants | Fiji | 0.0 /100 | #273 | Tragic 5.9% |
| Bahamians | 0.0 /100 | #274 | Tragic 5.9% |
| Immigrants | Latin America | 0.0 /100 | #275 | Tragic 5.9% |
| Immigrants | Central America | 0.0 /100 | #276 | Tragic 6.0% |
| Armenians | 0.0 /100 | #277 | Tragic 6.0% |
| Ghanaians | 0.0 /100 | #278 | Tragic 6.0% |
| Immigrants | Mexico | 0.0 /100 | #279 | Tragic 6.0% |
| Immigrants | Western Africa | 0.0 /100 | #280 | Tragic 6.0% |
| Africans | 0.0 /100 | #281 | Tragic 6.1% |
| Immigrants | Azores | 0.0 /100 | #282 | Tragic 6.1% |
| Immigrants | Ghana | 0.0 /100 | #283 | Tragic 6.1% |
Demographics Similar to Danes by Unemployment
In terms of unemployment, the demographic groups most similar to Danes are Czech (4.3%, a difference of 0.15%), Luxembourger (4.3%, a difference of 0.25%), Swedish (4.4%, a difference of 2.3%), German (4.5%, a difference of 3.1%), and Norwegian (4.2%, a difference of 3.6%).
| Demographics | Rating | Rank | Unemployment |
| Norwegians | 100.0 /100 | #1 | Exceptional 4.2% |
| Luxembourgers | 100.0 /100 | #2 | Exceptional 4.3% |
| Czechs | 100.0 /100 | #3 | Exceptional 4.3% |
| Danes | 100.0 /100 | #4 | Exceptional 4.3% |
| Swedes | 100.0 /100 | #5 | Exceptional 4.4% |
| Germans | 100.0 /100 | #6 | Exceptional 4.5% |
| Immigrants | India | 100.0 /100 | #7 | Exceptional 4.5% |
| Swiss | 100.0 /100 | #8 | Exceptional 4.5% |
| Scandinavians | 100.0 /100 | #9 | Exceptional 4.5% |
| Dutch | 100.0 /100 | #10 | Exceptional 4.6% |
| English | 100.0 /100 | #11 | Exceptional 4.6% |
| Pennsylvania Germans | 100.0 /100 | #12 | Exceptional 4.6% |
| Belgians | 100.0 /100 | #13 | Exceptional 4.6% |
| Immigrants | Cuba | 100.0 /100 | #14 | Exceptional 4.6% |
| Europeans | 99.9 /100 | #15 | Exceptional 4.6% |