Immigrants from Central America vs Cypriot Unemployment Among Ages 45 to 54 years

COMPARE

Immigrants from Central America
Race
Ancestry
AfghanAfricanAlaska NativeAlaskan AthabascanAlbanianAleutAlsatianAmericanApacheArabArapahoArgentineanArmenianAssyrian/Chaldean/SyriacAustralianAustrianBahamianBangladeshiBarbadianBasqueBelgianBelizeanBermudanBhutaneseBlackfeetBolivianBrazilianBritishBritish West IndianBulgarianBurmeseCajunCambodianCanadianCape VerdeanCarpatho RusynCelticCentral AmericanCentral American IndianCherokeeCheyenneChickasawChileanChineseChippewaChoctawColombianColvilleComancheCosta RicanCreeCreekCroatianCrowCubanCzechCzechoslovakianDanishDelawareDominicanDutchDutch West IndianEastern EuropeanEcuadorianEgyptianEnglishEstonianEthiopianEuropeanFijianFilipinoFinnishFrenchFrench American IndianFrench CanadianGermanGerman RussianGhanaianGreekGuamanian/ChamorroGuatemalanGuyaneseHaitianHmongHonduranHopiHoumaHungarianIcelanderIndian (Asian)IndonesianInupiatIranianIraqiIrishIroquoisIsraeliItalianJamaicanJapaneseJordanianKenyanKiowaKoreanLaotianLatvianLebaneseLiberianLithuanianLumbeeLuxembourgerMacedonianMalaysianMalteseMarshalleseMenomineeMexicanMexican American IndianMongolianMoroccanNative HawaiianNavajoNepaleseNew ZealanderNicaraguanNigerianNorthern EuropeanNorwegianOkinawanOsageOttawaPaiutePakistaniPalestinianPanamanianParaguayanPennsylvania GermanPeruvianPimaPolishPortuguesePotawatomiPuebloPuerto RicanPuget Sound SalishRomanianRussianSalvadoranSamoanScandinavianScotch-IrishScottishSeminoleSenegaleseSerbianShoshoneSierra LeoneanSiouxSlavicSlovakSloveneSomaliSouth AfricanSouth AmericanSouth American IndianSoviet UnionSpaniardSpanishSpanish AmericanSpanish American IndianSri LankanSubsaharan AfricanSudaneseSwedishSwissSyrianTaiwaneseThaiTlingit-HaidaTohono O'OdhamTonganTrinidadian and TobagonianTsimshianTurkishU.S. Virgin IslanderUgandanUkrainianUruguayanUteVenezuelanVietnameseWelshWest IndianYakamaYaquiYugoslavianYumanYup'ikZimbabwean
Immigration
NonimmigrantsImmigrantsAfghanistanAfricaAlbaniaArgentinaArmeniaAsiaAustraliaAustriaBahamasBangladeshBarbadosBelarusBelgiumBelizeBoliviaBosnia and HerzegovinaBrazilBulgariaBurma/MyanmarCabo VerdeCambodiaCameroonCanadaCaribbeanCentral AmericaChileChinaColombiaCongoCosta RicaCroatiaCubaCzechoslovakiaDenmarkDominicaDominican RepublicEastern AfricaEastern AsiaEastern EuropeEcuadorEgyptEl SalvadorEnglandEritreaEthiopiaEuropeFijiFranceGermanyGhanaGreeceGrenadaGuatemalaGuyanaHaitiHondurasHong KongHungaryIndiaIndonesiaIranIraqIrelandIsraelItalyJamaicaJapanJordanKazakhstanKenyaKoreaKuwaitLaosLatin AmericaLatviaLebanonLiberiaLithuaniaMalaysiaMexicoMicronesiaMiddle AfricaMoldovaMoroccoNepalNetherlandsNicaraguaNigeriaNorth AmericaNorth MacedoniaNorthern AfricaNorthern EuropeNorwayOceaniaPakistanPanamaPeruPhilippinesPolandPortugalRomaniaRussiaSaudi ArabiaScotlandSenegalSerbiaSierra LeoneSingaporeSomaliaSouth AfricaSouth AmericaSouth Central AsiaSouth Eastern AsiaSouthern EuropeSpainSri LankaSt. Vincent and the GrenadinesSudanSwedenSwitzerlandSyriaTaiwanThailandTrinidad and TobagoTurkeyUgandaUkraineUruguayUzbekistanVenezuelaVietnamWest IndiesWestern AfricaWestern AsiaWestern EuropeYemenZaireZimbabweAzores
Cypriot
Race
Ancestry
AfghanAfricanAlaska NativeAlaskan AthabascanAlbanianAleutAlsatianAmericanApacheArabArapahoArgentineanArmenianAssyrian/Chaldean/SyriacAustralianAustrianBahamianBangladeshiBarbadianBasqueBelgianBelizeanBermudanBhutaneseBlackfeetBolivianBrazilianBritishBritish West IndianBulgarianBurmeseCajunCambodianCanadianCape VerdeanCarpatho RusynCelticCentral AmericanCentral American IndianCherokeeCheyenneChickasawChileanChineseChippewaChoctawColombianColvilleComancheCosta RicanCreeCreekCroatianCrowCubanCypriotCzechCzechoslovakianDanishDelawareDominicanDutchDutch West IndianEastern EuropeanEcuadorianEgyptianEnglishEstonianEthiopianEuropeanFijianFilipinoFinnishFrenchFrench American IndianFrench CanadianGermanGerman RussianGhanaianGreekGuamanian/ChamorroGuatemalanGuyaneseHaitianHmongHonduranHopiHoumaHungarianIcelanderIndian (Asian)IndonesianInupiatIranianIraqiIrishIroquoisIsraeliItalianJamaicanJapaneseJordanianKenyanKiowaKoreanLaotianLatvianLebaneseLiberianLithuanianLumbeeLuxembourgerMacedonianMalaysianMalteseMarshalleseMenomineeMexicanMexican American IndianMongolianMoroccanNative HawaiianNavajoNepaleseNew ZealanderNicaraguanNigerianNorthern EuropeanNorwegianOkinawanOsageOttawaPaiutePakistaniPalestinianPanamanianParaguayanPennsylvania GermanPeruvianPimaPolishPortuguesePotawatomiPuebloPuerto RicanPuget Sound SalishRomanianRussianSalvadoranSamoanScandinavianScotch-IrishScottishSeminoleSenegaleseSerbianShoshoneSierra LeoneanSiouxSlavicSlovakSloveneSomaliSouth AfricanSouth AmericanSouth American IndianSoviet UnionSpaniardSpanishSpanish AmericanSpanish American IndianSri LankanSubsaharan AfricanSudaneseSwedishSwissSyrianTaiwaneseThaiTlingit-HaidaTohono O'OdhamTonganTrinidadian and TobagonianTsimshianTurkishU.S. Virgin IslanderUgandanUkrainianUruguayanUteVenezuelanVietnameseWelshWest IndianYakamaYaquiYugoslavianYumanYup'ikZimbabwean
Immigration
NonimmigrantsImmigrantsAfghanistanAfricaAlbaniaArgentinaArmeniaAsiaAustraliaAustriaBahamasBangladeshBarbadosBelarusBelgiumBelizeBoliviaBosnia and HerzegovinaBrazilBulgariaBurma/MyanmarCabo VerdeCambodiaCameroonCanadaCaribbeanChileChinaColombiaCongoCosta RicaCroatiaCubaCzechoslovakiaDenmarkDominicaDominican RepublicEastern AfricaEastern AsiaEastern EuropeEcuadorEgyptEl SalvadorEnglandEritreaEthiopiaEuropeFijiFranceGermanyGhanaGreeceGrenadaGuatemalaGuyanaHaitiHondurasHong KongHungaryIndiaIndonesiaIranIraqIrelandIsraelItalyJamaicaJapanJordanKazakhstanKenyaKoreaKuwaitLaosLatin AmericaLatviaLebanonLiberiaLithuaniaMalaysiaMexicoMicronesiaMiddle AfricaMoldovaMoroccoNepalNetherlandsNicaraguaNigeriaNorth AmericaNorth MacedoniaNorthern AfricaNorthern EuropeNorwayOceaniaPakistanPanamaPeruPhilippinesPolandPortugalRomaniaRussiaSaudi ArabiaScotlandSenegalSerbiaSierra LeoneSingaporeSomaliaSouth AfricaSouth AmericaSouth Central AsiaSouth Eastern AsiaSouthern EuropeSpainSri LankaSt. Vincent and the GrenadinesSudanSwedenSwitzerlandSyriaTaiwanThailandTrinidad and TobagoTurkeyUgandaUkraineUruguayUzbekistanVenezuelaVietnamWest IndiesWestern AfricaWestern AsiaWestern EuropeYemenZaireZimbabweAzores
Unemployment Among Ages 45 to 54 years
Income
Poverty
Unemployment
Labor Participation
Family Structure
Vehicle Availability
Education Level
Disability

Unemployment Among Ages 45 to 54 years Comparison

Immigrants from Central America

Cypriots

Tragic
Good
5.0%
UNEMPLOYMENT AMONG AGES 45 TO 54 YEARS
0.0/ 100
METRIC RATING
272nd/ 347
METRIC RANK
4.5%
UNEMPLOYMENT AMONG AGES 45 TO 54 YEARS
74.4/ 100
METRIC RATING
151st/ 347
METRIC RANK

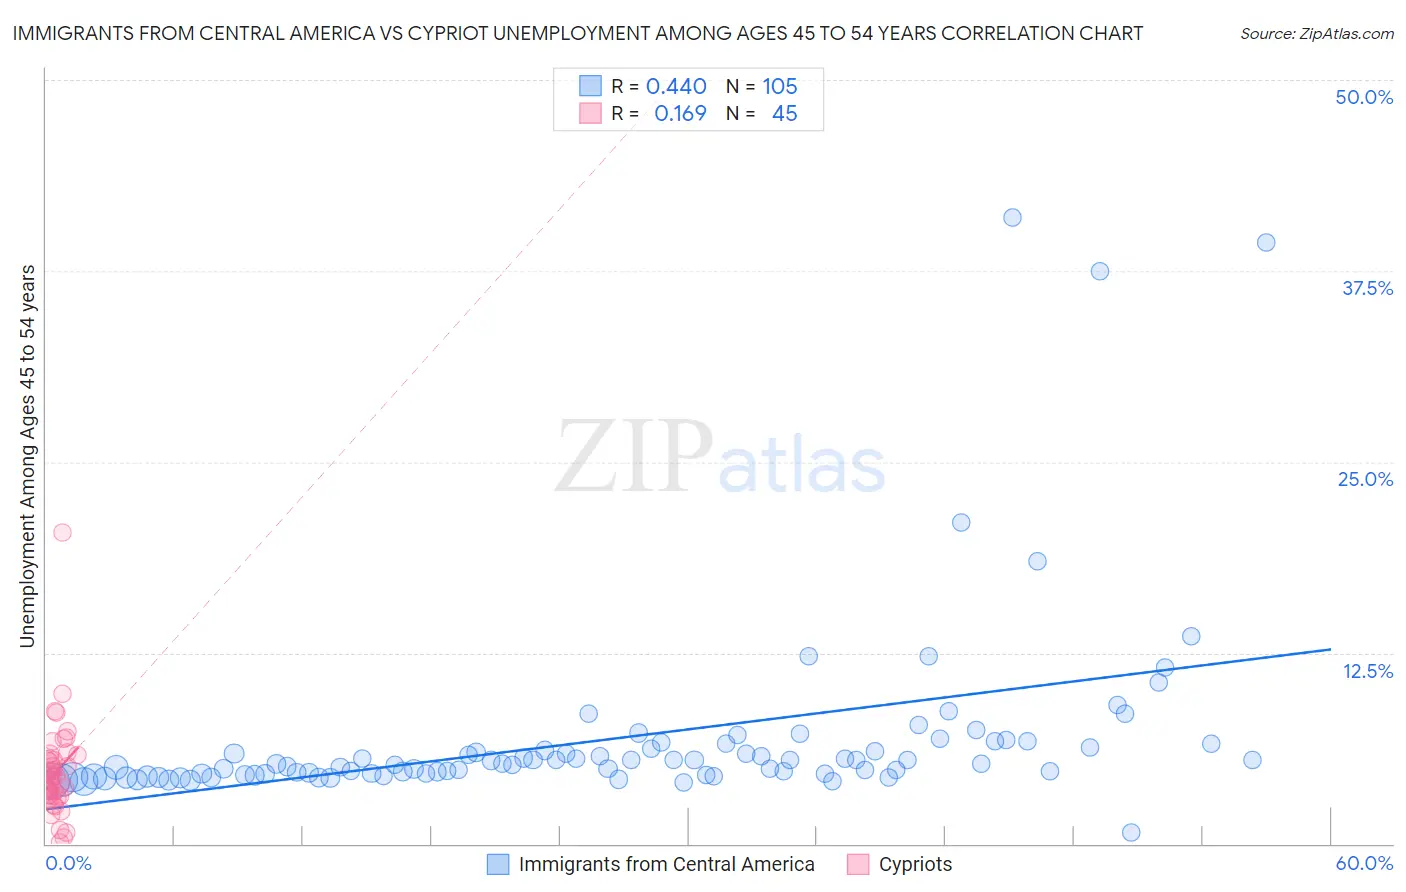
Immigrants from Central America vs Cypriot Unemployment Among Ages 45 to 54 years Correlation Chart

The statistical analysis conducted on geographies consisting of 505,939,152 people shows a moderate positive correlation between the proportion of Immigrants from Central America and unemployment rate among population between the ages 45 and 54 in the United States with a correlation coefficient (R) of 0.440 and weighted average of 5.0%. Similarly, the statistical analysis conducted on geographies consisting of 61,639,842 people shows a poor positive correlation between the proportion of Cypriots and unemployment rate among population between the ages 45 and 54 in the United States with a correlation coefficient (R) of 0.169 and weighted average of 4.5%, a difference of 11.4%.
Immigrants from Central America vs Cypriot Unemployment Among Ages 45 to 54 years

Unemployment Among Ages 45 to 54 years Correlation Summary

MeasurementImmigrants from Central AmericaCypriot
Minimum0.70%0.10%
Maximum41.0%20.4%
Range40.3%20.3%
Mean6.9%4.7%
Median5.2%4.2%
Interquartile 25% (IQ1)4.5%3.1%
Interquartile 75% (IQ3)6.4%5.7%
Interquartile Range (IQR)1.9%2.6%
Standard Deviation (Sample)6.2%3.2%
Standard Deviation (Population)6.2%3.2%

Similar Demographics by Unemployment Among Ages 45 to 54 years

Demographics Similar to Immigrants from Central America by Unemployment Among Ages 45 to 54 years

In terms of unemployment among ages 45 to 54 years, the demographic groups most similar to Immigrants from Central America are Immigrants from Latin America (5.0%, a difference of 0.16%), Cajun (5.0%, a difference of 0.17%), U.S. Virgin Islander (5.0%, a difference of 0.22%), Immigrants from Ghana (5.0%, a difference of 0.25%), and Bermudan (5.0%, a difference of 0.27%).
DemographicsRating | RankUnemployment Among Ages 45 to 54 years
Immigrants | Somalia
0.1
/100
|
#265
Tragic
4.9%
Ghanaians
0.0
/100
|
#266
Tragic
4.9%
Bahamians
0.0
/100
|
#267
Tragic
4.9%
Immigrants | Uzbekistan
0.0
/100
|
#268
Tragic
4.9%
Somalis
0.0
/100
|
#269
Tragic
5.0%
Immigrants | Ghana
0.0
/100
|
#270
Tragic
5.0%
Cajuns
0.0
/100
|
#271
Tragic
5.0%
Immigrants | Central America
0.0
/100
|
#272
Tragic
5.0%
Immigrants | Latin America
0.0
/100
|
#273
Tragic
5.0%
U.S. Virgin Islanders
0.0
/100
|
#274
Tragic
5.0%
Bermudans
0.0
/100
|
#275
Tragic
5.0%
French American Indians
0.0
/100
|
#276
Tragic
5.0%
Immigrants | Mexico
0.0
/100
|
#277
Tragic
5.0%
Dutch West Indians
0.0
/100
|
#278
Tragic
5.0%
Nepalese
0.0
/100
|
#279
Tragic
5.0%

Demographics Similar to Cypriots by Unemployment Among Ages 45 to 54 years

In terms of unemployment among ages 45 to 54 years, the demographic groups most similar to Cypriots are Tsimshian (4.5%, a difference of 0.010%), Immigrants from Austria (4.5%, a difference of 0.060%), Costa Rican (4.5%, a difference of 0.060%), Korean (4.5%, a difference of 0.080%), and Hungarian (4.5%, a difference of 0.090%).
DemographicsRating | RankUnemployment Among Ages 45 to 54 years
Taiwanese
77.9
/100
|
#144
Good
4.5%
Immigrants | Latvia
77.5
/100
|
#145
Good
4.5%
Syrians
77.3
/100
|
#146
Good
4.5%
Uruguayans
76.9
/100
|
#147
Good
4.5%
Immigrants | Austria
75.3
/100
|
#148
Good
4.5%
Costa Ricans
75.3
/100
|
#149
Good
4.5%
Tsimshian
74.6
/100
|
#150
Good
4.5%
Cypriots
74.4
/100
|
#151
Good
4.5%
Koreans
73.1
/100
|
#152
Good
4.5%
Hungarians
73.0
/100
|
#153
Good
4.5%
Immigrants | Spain
72.5
/100
|
#154
Good
4.5%
Marshallese
70.6
/100
|
#155
Good
4.5%
Immigrants | Croatia
69.6
/100
|
#156
Good
4.5%
Indians (Asian)
68.1
/100
|
#157
Good
4.5%
Immigrants | Italy
65.5
/100
|
#158
Good
4.5%