Immigrants from Caribbean vs Tlingit-Haida Unemployment Among Ages 30 to 34 years
COMPARE
Immigrants from Caribbean
Tlingit-Haida
Unemployment Among Ages 30 to 34 years
Unemployment Among Ages 30 to 34 years Comparison
Immigrants from Caribbean
Tlingit-Haida
6.4%
UNEMPLOYMENT AMONG AGES 30 TO 34 YEARS
0.0/ 100
METRIC RATING
281st/ 347
METRIC RANK
6.0%
UNEMPLOYMENT AMONG AGES 30 TO 34 YEARS
0.2/ 100
METRIC RATING
251st/ 347
METRIC RANK
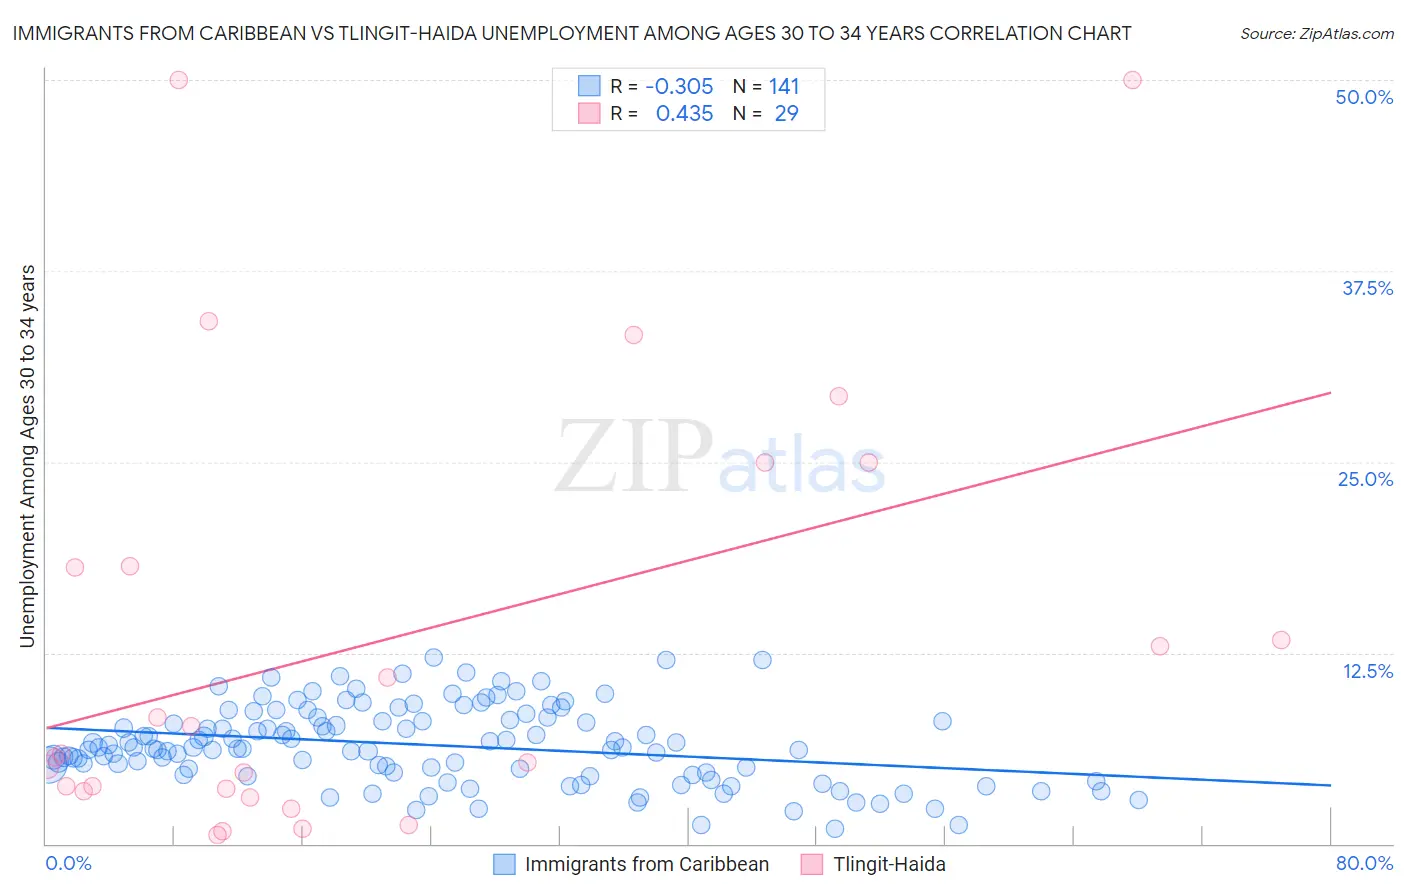
Immigrants from Caribbean vs Tlingit-Haida Unemployment Among Ages 30 to 34 years Correlation Chart
The statistical analysis conducted on geographies consisting of 419,806,633 people shows a mild negative correlation between the proportion of Immigrants from Caribbean and unemployment rate among population between the ages 30 and 34 in the United States with a correlation coefficient (R) of -0.305 and weighted average of 6.4%. Similarly, the statistical analysis conducted on geographies consisting of 59,624,165 people shows a moderate positive correlation between the proportion of Tlingit-Haida and unemployment rate among population between the ages 30 and 34 in the United States with a correlation coefficient (R) of 0.435 and weighted average of 6.0%, a difference of 5.9%.
Unemployment Among Ages 30 to 34 years Correlation Summary
| Measurement | Immigrants from Caribbean | Tlingit-Haida |
| Minimum | 1.0% | 0.60% |
| Maximum | 12.2% | 50.0% |
| Range | 11.2% | 49.4% |
| Mean | 6.5% | 13.3% |
| Median | 6.3% | 5.9% |
| Interquartile 25% (IQ1) | 4.6% | 3.5% |
| Interquartile 75% (IQ3) | 8.2% | 21.6% |
| Interquartile Range (IQR) | 3.6% | 18.1% |
| Standard Deviation (Sample) | 2.5% | 14.3% |
| Standard Deviation (Population) | 2.5% | 14.0% |
Similar Demographics by Unemployment Among Ages 30 to 34 years
Demographics Similar to Immigrants from Caribbean by Unemployment Among Ages 30 to 34 years
In terms of unemployment among ages 30 to 34 years, the demographic groups most similar to Immigrants from Caribbean are Cherokee (6.4%, a difference of 0.32%), Cree (6.4%, a difference of 0.37%), African (6.4%, a difference of 0.37%), Hispanic or Latino (6.4%, a difference of 0.40%), and Immigrants from Bangladesh (6.4%, a difference of 0.47%).
| Demographics | Rating | Rank | Unemployment Among Ages 30 to 34 years |
| U.S. Virgin Islanders | 0.0 /100 | #274 | Tragic 6.3% |
| Ecuadorians | 0.0 /100 | #275 | Tragic 6.3% |
| Pennsylvania Germans | 0.0 /100 | #276 | Tragic 6.3% |
| Immigrants | Ecuador | 0.0 /100 | #277 | Tragic 6.3% |
| Osage | 0.0 /100 | #278 | Tragic 6.3% |
| Cree | 0.0 /100 | #279 | Tragic 6.4% |
| Cherokee | 0.0 /100 | #280 | Tragic 6.4% |
| Immigrants | Caribbean | 0.0 /100 | #281 | Tragic 6.4% |
| Africans | 0.0 /100 | #282 | Tragic 6.4% |
| Hispanics or Latinos | 0.0 /100 | #283 | Tragic 6.4% |
| Immigrants | Bangladesh | 0.0 /100 | #284 | Tragic 6.4% |
| Choctaw | 0.0 /100 | #285 | Tragic 6.4% |
| Central American Indians | 0.0 /100 | #286 | Tragic 6.4% |
| Immigrants | West Indies | 0.0 /100 | #287 | Tragic 6.4% |
| Senegalese | 0.0 /100 | #288 | Tragic 6.4% |
Demographics Similar to Tlingit-Haida by Unemployment Among Ages 30 to 34 years
In terms of unemployment among ages 30 to 34 years, the demographic groups most similar to Tlingit-Haida are Potawatomi (6.0%, a difference of 0.020%), Immigrants from Honduras (6.0%, a difference of 0.20%), Immigrants from Guatemala (6.0%, a difference of 0.29%), Honduran (6.0%, a difference of 0.29%), and Nigerian (6.0%, a difference of 0.30%).
| Demographics | Rating | Rank | Unemployment Among Ages 30 to 34 years |
| Immigrants | Micronesia | 0.3 /100 | #244 | Tragic 6.0% |
| Sub-Saharan Africans | 0.3 /100 | #245 | Tragic 6.0% |
| Ghanaians | 0.3 /100 | #246 | Tragic 6.0% |
| Nigerians | 0.3 /100 | #247 | Tragic 6.0% |
| Immigrants | Guatemala | 0.3 /100 | #248 | Tragic 6.0% |
| Hondurans | 0.3 /100 | #249 | Tragic 6.0% |
| Immigrants | Honduras | 0.3 /100 | #250 | Tragic 6.0% |
| Tlingit-Haida | 0.2 /100 | #251 | Tragic 6.0% |
| Potawatomi | 0.2 /100 | #252 | Tragic 6.0% |
| Immigrants | Nonimmigrants | 0.2 /100 | #253 | Tragic 6.1% |
| Armenians | 0.1 /100 | #254 | Tragic 6.1% |
| Immigrants | Portugal | 0.1 /100 | #255 | Tragic 6.1% |
| Immigrants | Ghana | 0.1 /100 | #256 | Tragic 6.1% |
| Immigrants | Sierra Leone | 0.1 /100 | #257 | Tragic 6.1% |
| Mexicans | 0.1 /100 | #258 | Tragic 6.1% |