Immigrants from Caribbean vs Sioux Unemployment Among Ages 16 to 19 years
COMPARE
Immigrants from Caribbean
Sioux
Unemployment Among Ages 16 to 19 years
Unemployment Among Ages 16 to 19 years Comparison
Immigrants from Caribbean
Sioux
20.9%
UNEMPLOYMENT AMONG AGES 16 TO 19 YEARS
0.0/ 100
METRIC RATING
302nd/ 347
METRIC RANK
19.7%
UNEMPLOYMENT AMONG AGES 16 TO 19 YEARS
0.0/ 100
METRIC RATING
283rd/ 347
METRIC RANK
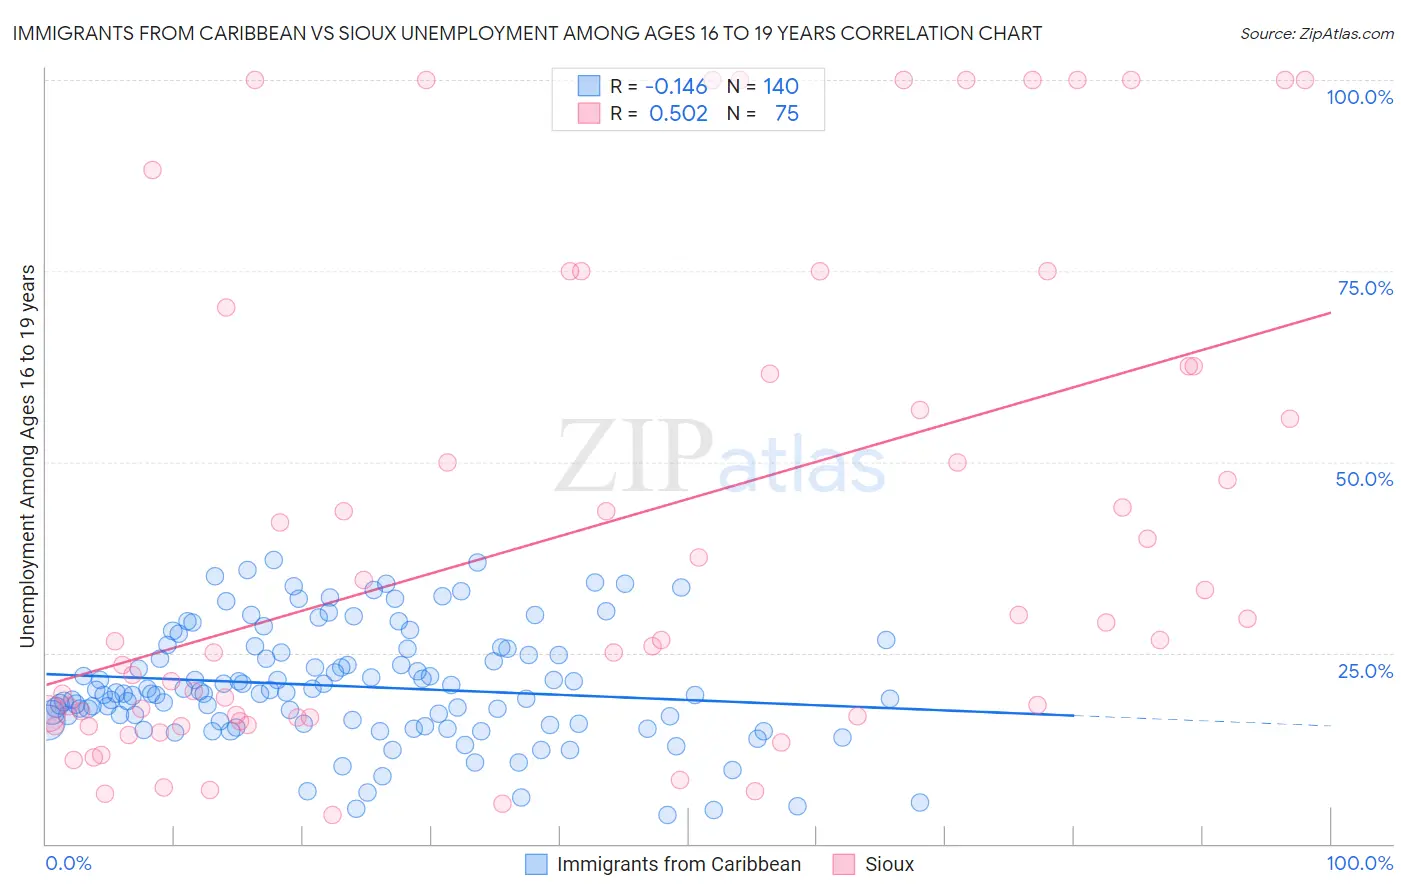
Immigrants from Caribbean vs Sioux Unemployment Among Ages 16 to 19 years Correlation Chart
The statistical analysis conducted on geographies consisting of 422,539,513 people shows a poor negative correlation between the proportion of Immigrants from Caribbean and unemployment rate among population between the ages 16 and 19 in the United States with a correlation coefficient (R) of -0.146 and weighted average of 20.9%. Similarly, the statistical analysis conducted on geographies consisting of 225,477,906 people shows a substantial positive correlation between the proportion of Sioux and unemployment rate among population between the ages 16 and 19 in the United States with a correlation coefficient (R) of 0.502 and weighted average of 19.7%, a difference of 6.0%.
Unemployment Among Ages 16 to 19 years Correlation Summary
| Measurement | Immigrants from Caribbean | Sioux |
| Minimum | 3.7% | 3.7% |
| Maximum | 37.1% | 100.0% |
| Range | 33.4% | 96.3% |
| Mean | 20.6% | 40.6% |
| Median | 19.7% | 26.6% |
| Interquartile 25% (IQ1) | 15.8% | 16.5% |
| Interquartile 75% (IQ3) | 25.3% | 62.5% |
| Interquartile Range (IQR) | 9.5% | 46.0% |
| Standard Deviation (Sample) | 7.4% | 31.6% |
| Standard Deviation (Population) | 7.4% | 31.4% |
Demographics Similar to Immigrants from Caribbean and Sioux by Unemployment Among Ages 16 to 19 years
In terms of unemployment among ages 16 to 19 years, the demographic groups most similar to Immigrants from Caribbean are Immigrants from Ecuador (20.9%, a difference of 0.11%), Ecuadorian (20.5%, a difference of 1.7%), Immigrants from Uzbekistan (20.5%, a difference of 1.8%), Haitian (20.5%, a difference of 1.8%), and Alsatian (20.5%, a difference of 1.9%). Similarly, the demographic groups most similar to Sioux are Sierra Leonean (19.7%, a difference of 0.010%), Dutch West Indian (19.7%, a difference of 0.050%), Ghanaian (19.8%, a difference of 0.19%), Bahamian (19.8%, a difference of 0.31%), and Immigrants from Ghana (19.8%, a difference of 0.38%).
| Demographics | Rating | Rank | Unemployment Among Ages 16 to 19 years |
| Dutch West Indians | 0.0 /100 | #282 | Tragic 19.7% |
| Sioux | 0.0 /100 | #283 | Tragic 19.7% |
| Sierra Leoneans | 0.0 /100 | #284 | Tragic 19.7% |
| Ghanaians | 0.0 /100 | #285 | Tragic 19.8% |
| Bahamians | 0.0 /100 | #286 | Tragic 19.8% |
| Immigrants | Ghana | 0.0 /100 | #287 | Tragic 19.8% |
| Immigrants | Azores | 0.0 /100 | #288 | Tragic 19.8% |
| Pueblo | 0.0 /100 | #289 | Tragic 19.8% |
| Immigrants | Sierra Leone | 0.0 /100 | #290 | Tragic 20.0% |
| Immigrants | Yemen | 0.0 /100 | #291 | Tragic 20.0% |
| Comanche | 0.0 /100 | #292 | Tragic 20.2% |
| Immigrants | Bahamas | 0.0 /100 | #293 | Tragic 20.4% |
| Immigrants | Haiti | 0.0 /100 | #294 | Tragic 20.4% |
| Central American Indians | 0.0 /100 | #295 | Tragic 20.4% |
| Armenians | 0.0 /100 | #296 | Tragic 20.5% |
| Alsatians | 0.0 /100 | #297 | Tragic 20.5% |
| Haitians | 0.0 /100 | #298 | Tragic 20.5% |
| Immigrants | Uzbekistan | 0.0 /100 | #299 | Tragic 20.5% |
| Ecuadorians | 0.0 /100 | #300 | Tragic 20.5% |
| Immigrants | Ecuador | 0.0 /100 | #301 | Tragic 20.9% |
| Immigrants | Caribbean | 0.0 /100 | #302 | Tragic 20.9% |