Immigrants from Caribbean vs Immigrants from Bangladesh Male Unemployment
COMPARE
Immigrants from Caribbean
Immigrants from Bangladesh
Male Unemployment
Male Unemployment Comparison
Immigrants from Caribbean
Immigrants from Bangladesh
6.3%
MALE UNEMPLOYMENT
0.0/ 100
METRIC RATING
289th/ 347
METRIC RANK
6.6%
MALE UNEMPLOYMENT
0.0/ 100
METRIC RATING
299th/ 347
METRIC RANK
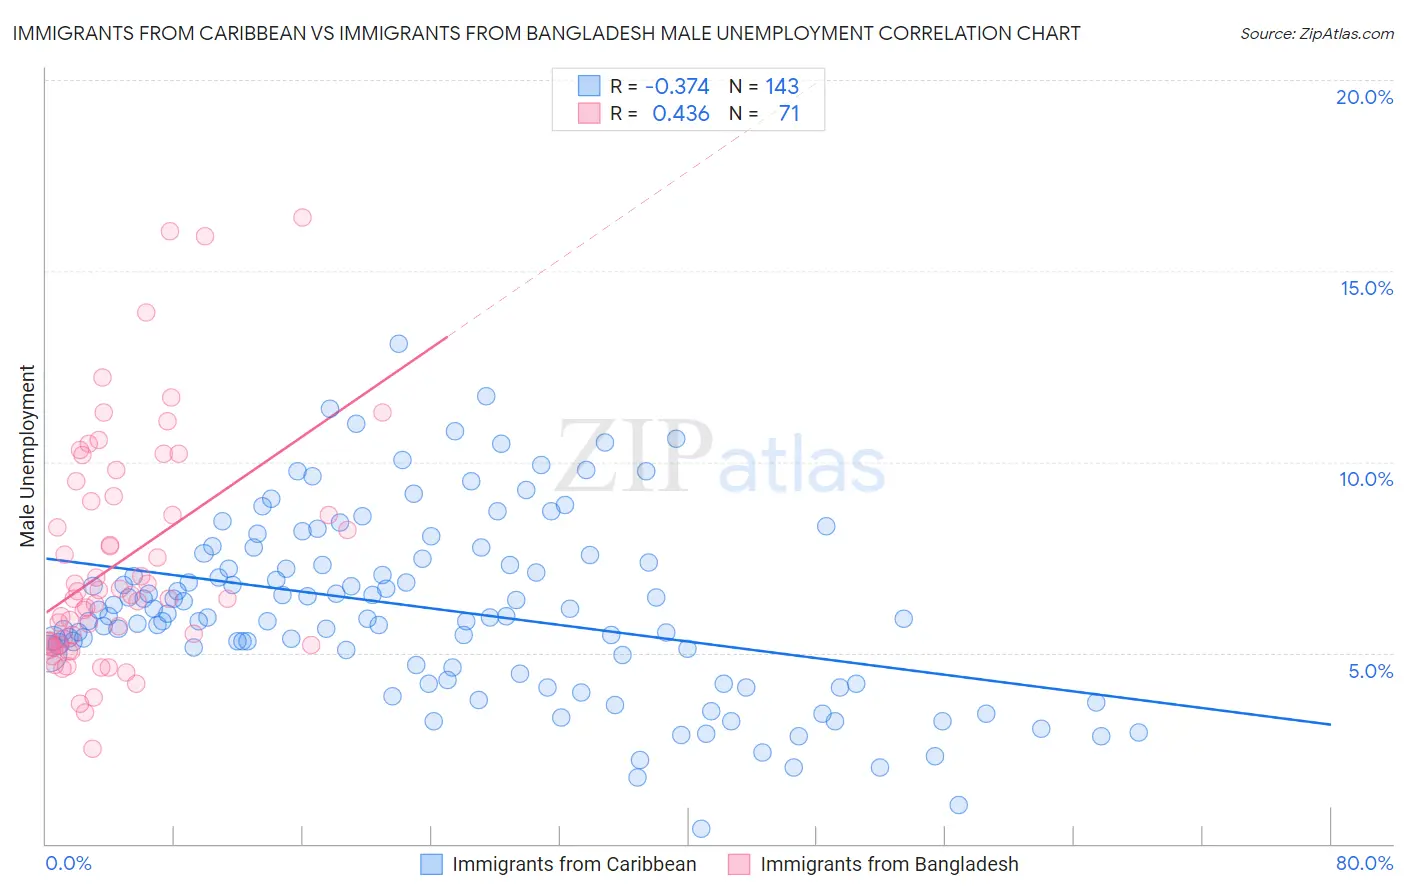
Immigrants from Caribbean vs Immigrants from Bangladesh Male Unemployment Correlation Chart
The statistical analysis conducted on geographies consisting of 447,554,684 people shows a mild negative correlation between the proportion of Immigrants from Caribbean and unemployment rate among males in the United States with a correlation coefficient (R) of -0.374 and weighted average of 6.3%. Similarly, the statistical analysis conducted on geographies consisting of 203,494,177 people shows a moderate positive correlation between the proportion of Immigrants from Bangladesh and unemployment rate among males in the United States with a correlation coefficient (R) of 0.436 and weighted average of 6.6%, a difference of 4.5%.
Male Unemployment Correlation Summary
| Measurement | Immigrants from Caribbean | Immigrants from Bangladesh |
| Minimum | 0.40% | 2.5% |
| Maximum | 13.1% | 16.4% |
| Range | 12.7% | 13.9% |
| Mean | 6.1% | 7.4% |
| Median | 6.0% | 6.4% |
| Interquartile 25% (IQ1) | 4.6% | 5.2% |
| Interquartile 75% (IQ3) | 7.5% | 9.1% |
| Interquartile Range (IQR) | 2.8% | 3.9% |
| Standard Deviation (Sample) | 2.4% | 3.0% |
| Standard Deviation (Population) | 2.3% | 3.0% |
Demographics Similar to Immigrants from Caribbean and Immigrants from Bangladesh by Male Unemployment
In terms of male unemployment, the demographic groups most similar to Immigrants from Caribbean are Immigrants from Senegal (6.3%, a difference of 0.12%), Central American Indian (6.3%, a difference of 0.16%), African (6.3%, a difference of 0.45%), Immigrants from Ecuador (6.2%, a difference of 0.88%), and Spanish American Indian (6.2%, a difference of 0.90%). Similarly, the demographic groups most similar to Immigrants from Bangladesh are Jamaican (6.6%, a difference of 0.13%), Chippewa (6.6%, a difference of 0.21%), Vietnamese (6.6%, a difference of 0.27%), Immigrants from Belize (6.6%, a difference of 0.38%), and Immigrants from Haiti (6.5%, a difference of 0.53%).
| Demographics | Rating | Rank | Male Unemployment |
| Spanish American Indians | 0.0 /100 | #284 | Tragic 6.2% |
| Immigrants | Ecuador | 0.0 /100 | #285 | Tragic 6.2% |
| Africans | 0.0 /100 | #286 | Tragic 6.3% |
| Central American Indians | 0.0 /100 | #287 | Tragic 6.3% |
| Immigrants | Senegal | 0.0 /100 | #288 | Tragic 6.3% |
| Immigrants | Caribbean | 0.0 /100 | #289 | Tragic 6.3% |
| U.S. Virgin Islanders | 0.0 /100 | #290 | Tragic 6.4% |
| Immigrants | Azores | 0.0 /100 | #291 | Tragic 6.4% |
| Nepalese | 0.0 /100 | #292 | Tragic 6.4% |
| Haitians | 0.0 /100 | #293 | Tragic 6.4% |
| Senegalese | 0.0 /100 | #294 | Tragic 6.4% |
| Belizeans | 0.0 /100 | #295 | Tragic 6.5% |
| Immigrants | Haiti | 0.0 /100 | #296 | Tragic 6.5% |
| Chippewa | 0.0 /100 | #297 | Tragic 6.6% |
| Jamaicans | 0.0 /100 | #298 | Tragic 6.6% |
| Immigrants | Bangladesh | 0.0 /100 | #299 | Tragic 6.6% |
| Vietnamese | 0.0 /100 | #300 | Tragic 6.6% |
| Immigrants | Belize | 0.0 /100 | #301 | Tragic 6.6% |
| Ute | 0.0 /100 | #302 | Tragic 6.6% |
| Immigrants | West Indies | 0.0 /100 | #303 | Tragic 6.7% |
| West Indians | 0.0 /100 | #304 | Tragic 6.7% |