Immigrants from Canada vs Immigrants from the Azores Unemployment Among Seniors over 75 years
COMPARE
Immigrants from Canada
Immigrants from the Azores
Unemployment Among Seniors over 75 years
Unemployment Among Seniors over 75 years Comparison
Immigrants from Canada
Immigrants from the Azores
9.2%
UNEMPLOYMENT AMONG SENIORS OVER 75 YEARS
2.6/ 100
METRIC RATING
245th/ 347
METRIC RANK
10.7%
UNEMPLOYMENT AMONG SENIORS OVER 75 YEARS
0.0/ 100
METRIC RATING
330th/ 347
METRIC RANK
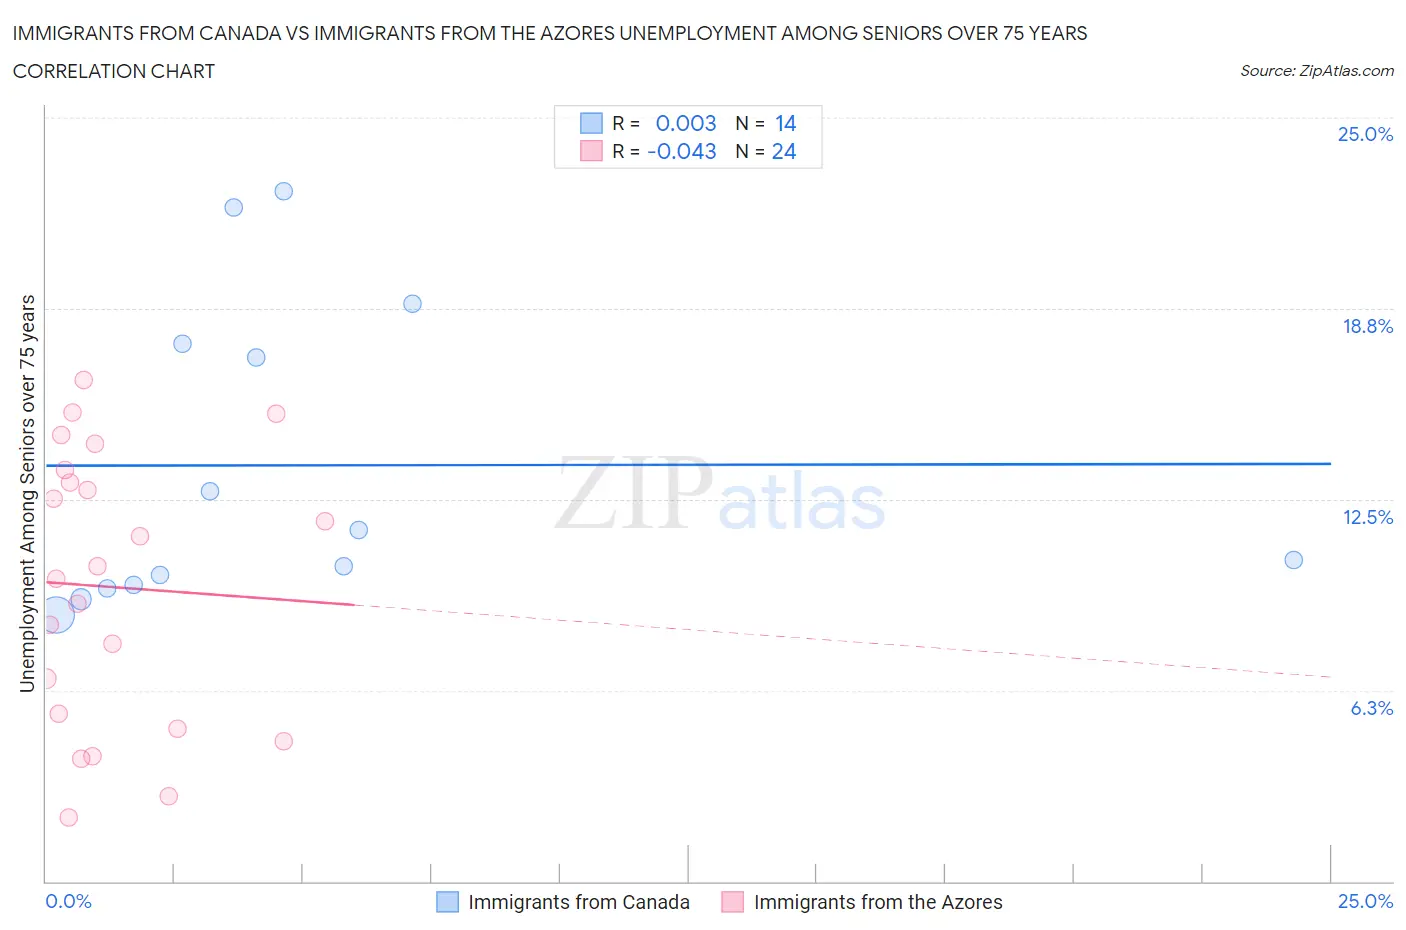
Immigrants from Canada vs Immigrants from the Azores Unemployment Among Seniors over 75 years Correlation Chart
The statistical analysis conducted on geographies consisting of 217,046,836 people shows no correlation between the proportion of Immigrants from Canada and unemployment rate among seniors over the age of 75 in the United States with a correlation coefficient (R) of 0.003 and weighted average of 9.2%. Similarly, the statistical analysis conducted on geographies consisting of 32,495,694 people shows no correlation between the proportion of Immigrants from the Azores and unemployment rate among seniors over the age of 75 in the United States with a correlation coefficient (R) of -0.043 and weighted average of 10.7%, a difference of 16.7%.
Unemployment Among Seniors over 75 years Correlation Summary
| Measurement | Immigrants from Canada | Immigrants from the Azores |
| Minimum | 8.7% | 2.1% |
| Maximum | 22.6% | 16.4% |
| Range | 13.9% | 14.3% |
| Mean | 13.6% | 9.6% |
| Median | 11.0% | 10.1% |
| Interquartile 25% (IQ1) | 9.7% | 5.2% |
| Interquartile 75% (IQ3) | 17.6% | 13.3% |
| Interquartile Range (IQR) | 7.9% | 8.0% |
| Standard Deviation (Sample) | 5.0% | 4.4% |
| Standard Deviation (Population) | 4.8% | 4.3% |
Similar Demographics by Unemployment Among Seniors over 75 years
Demographics Similar to Immigrants from Canada by Unemployment Among Seniors over 75 years
In terms of unemployment among seniors over 75 years, the demographic groups most similar to Immigrants from Canada are Immigrants from Germany (9.2%, a difference of 0.060%), Sierra Leonean (9.2%, a difference of 0.090%), Slavic (9.2%, a difference of 0.090%), Immigrants from Southern Europe (9.2%, a difference of 0.12%), and Immigrants from North America (9.2%, a difference of 0.12%).
| Demographics | Rating | Rank | Unemployment Among Seniors over 75 years |
| Inupiat | 3.6 /100 | #238 | Tragic 9.1% |
| Mexicans | 3.5 /100 | #239 | Tragic 9.1% |
| Spanish | 3.3 /100 | #240 | Tragic 9.1% |
| Immigrants | Southern Europe | 2.8 /100 | #241 | Tragic 9.2% |
| Sierra Leoneans | 2.8 /100 | #242 | Tragic 9.2% |
| Slavs | 2.8 /100 | #243 | Tragic 9.2% |
| Immigrants | Germany | 2.7 /100 | #244 | Tragic 9.2% |
| Immigrants | Canada | 2.6 /100 | #245 | Tragic 9.2% |
| Immigrants | North America | 2.4 /100 | #246 | Tragic 9.2% |
| Sub-Saharan Africans | 2.3 /100 | #247 | Tragic 9.2% |
| Blackfeet | 2.3 /100 | #248 | Tragic 9.2% |
| Immigrants | Saudi Arabia | 2.2 /100 | #249 | Tragic 9.2% |
| Central American Indians | 2.2 /100 | #250 | Tragic 9.2% |
| Immigrants | Poland | 2.0 /100 | #251 | Tragic 9.2% |
| Immigrants | Sudan | 2.0 /100 | #252 | Tragic 9.2% |
Demographics Similar to Immigrants from the Azores by Unemployment Among Seniors over 75 years
In terms of unemployment among seniors over 75 years, the demographic groups most similar to Immigrants from the Azores are Tohono O'odham (10.8%, a difference of 1.0%), Tsimshian (10.5%, a difference of 1.6%), Immigrants from Liberia (10.9%, a difference of 1.8%), Immigrants from Portugal (10.5%, a difference of 1.9%), and Dutch (10.4%, a difference of 2.6%).
| Demographics | Rating | Rank | Unemployment Among Seniors over 75 years |
| Tongans | 0.0 /100 | #323 | Tragic 10.4% |
| Americans | 0.0 /100 | #324 | Tragic 10.4% |
| Portuguese | 0.0 /100 | #325 | Tragic 10.4% |
| Slovaks | 0.0 /100 | #326 | Tragic 10.4% |
| Dutch | 0.0 /100 | #327 | Tragic 10.4% |
| Immigrants | Portugal | 0.0 /100 | #328 | Tragic 10.5% |
| Tsimshian | 0.0 /100 | #329 | Tragic 10.5% |
| Immigrants | Azores | 0.0 /100 | #330 | Tragic 10.7% |
| Tohono O'odham | 0.0 /100 | #331 | Tragic 10.8% |
| Immigrants | Liberia | 0.0 /100 | #332 | Tragic 10.9% |
| Alaskan Athabascans | 0.0 /100 | #333 | Tragic 11.0% |
| Assyrians/Chaldeans/Syriacs | 0.0 /100 | #334 | Tragic 11.1% |
| French Canadians | 0.0 /100 | #335 | Tragic 11.2% |
| Immigrants | North Macedonia | 0.0 /100 | #336 | Tragic 11.3% |
| Cape Verdeans | 0.0 /100 | #337 | Tragic 11.4% |