Immigrants from Cambodia vs Immigrants from North Macedonia Unemployment Among Women with Children Under 6 years
COMPARE
Immigrants from Cambodia
Immigrants from North Macedonia
Unemployment Among Women with Children Under 6 years
Unemployment Among Women with Children Under 6 years Comparison
Immigrants from Cambodia
Immigrants from North Macedonia
7.4%
UNEMPLOYMENT AMONG WOMEN WITH CHILDREN UNDER 6 YEARS
84.6/ 100
METRIC RATING
137th/ 347
METRIC RANK
7.7%
UNEMPLOYMENT AMONG WOMEN WITH CHILDREN UNDER 6 YEARS
34.4/ 100
METRIC RATING
190th/ 347
METRIC RANK
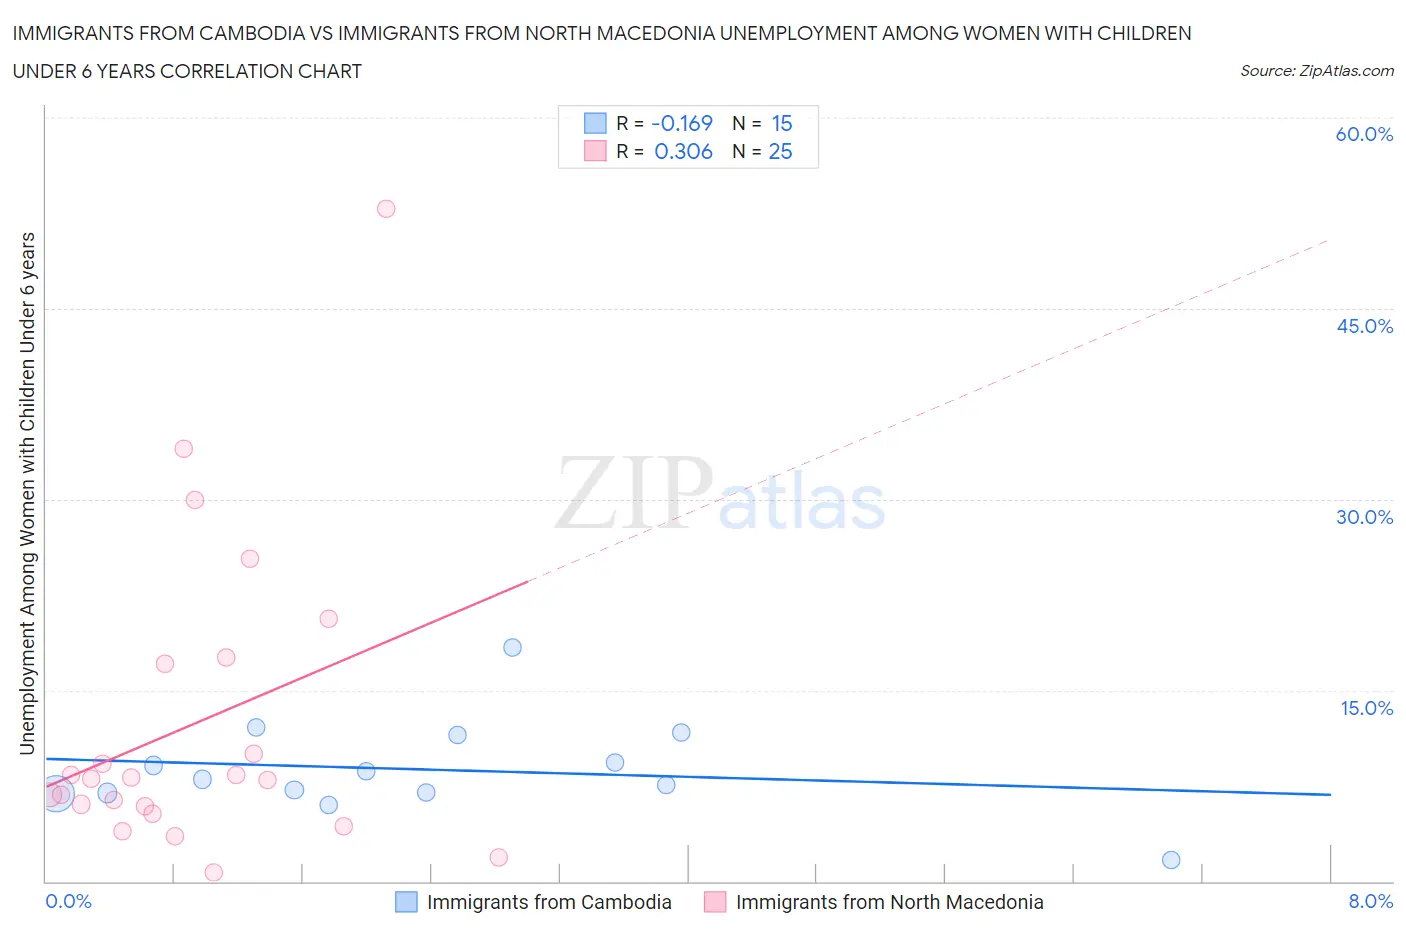
Immigrants from Cambodia vs Immigrants from North Macedonia Unemployment Among Women with Children Under 6 years Correlation Chart
The statistical analysis conducted on geographies consisting of 176,492,322 people shows a poor negative correlation between the proportion of Immigrants from Cambodia and unemployment rate among women with children under the age of 6 in the United States with a correlation coefficient (R) of -0.169 and weighted average of 7.4%. Similarly, the statistical analysis conducted on geographies consisting of 65,526,409 people shows a mild positive correlation between the proportion of Immigrants from North Macedonia and unemployment rate among women with children under the age of 6 in the United States with a correlation coefficient (R) of 0.306 and weighted average of 7.7%, a difference of 4.0%.
Unemployment Among Women with Children Under 6 years Correlation Summary
| Measurement | Immigrants from Cambodia | Immigrants from North Macedonia |
| Minimum | 1.7% | 0.70% |
| Maximum | 18.4% | 52.8% |
| Range | 16.7% | 52.1% |
| Mean | 8.8% | 12.4% |
| Median | 8.0% | 8.0% |
| Interquartile 25% (IQ1) | 6.9% | 5.6% |
| Interquartile 75% (IQ3) | 11.5% | 17.3% |
| Interquartile Range (IQR) | 4.5% | 11.7% |
| Standard Deviation (Sample) | 3.7% | 12.1% |
| Standard Deviation (Population) | 3.6% | 11.8% |
Similar Demographics by Unemployment Among Women with Children Under 6 years
Demographics Similar to Immigrants from Cambodia by Unemployment Among Women with Children Under 6 years
In terms of unemployment among women with children under 6 years, the demographic groups most similar to Immigrants from Cambodia are Immigrants from Morocco (7.4%, a difference of 0.030%), Immigrants from Norway (7.4%, a difference of 0.070%), Immigrants from Northern Africa (7.4%, a difference of 0.090%), Immigrants from Colombia (7.4%, a difference of 0.090%), and Immigrants from Bolivia (7.4%, a difference of 0.15%).
| Demographics | Rating | Rank | Unemployment Among Women with Children Under 6 years |
| Swedes | 88.4 /100 | #130 | Excellent 7.4% |
| Ukrainians | 88.2 /100 | #131 | Excellent 7.4% |
| Immigrants | Armenia | 87.4 /100 | #132 | Excellent 7.4% |
| Immigrants | Uganda | 86.5 /100 | #133 | Excellent 7.4% |
| Immigrants | Bolivia | 85.7 /100 | #134 | Excellent 7.4% |
| Immigrants | Northern Africa | 85.3 /100 | #135 | Excellent 7.4% |
| Immigrants | Morocco | 84.9 /100 | #136 | Excellent 7.4% |
| Immigrants | Cambodia | 84.6 /100 | #137 | Excellent 7.4% |
| Immigrants | Norway | 84.1 /100 | #138 | Excellent 7.4% |
| Immigrants | Colombia | 83.9 /100 | #139 | Excellent 7.4% |
| Scandinavians | 83.0 /100 | #140 | Excellent 7.4% |
| Greeks | 82.6 /100 | #141 | Excellent 7.4% |
| Immigrants | Argentina | 81.5 /100 | #142 | Excellent 7.5% |
| Koreans | 81.3 /100 | #143 | Excellent 7.5% |
| Europeans | 79.1 /100 | #144 | Good 7.5% |
Demographics Similar to Immigrants from North Macedonia by Unemployment Among Women with Children Under 6 years
In terms of unemployment among women with children under 6 years, the demographic groups most similar to Immigrants from North Macedonia are Immigrants from Panama (7.7%, a difference of 0.090%), Immigrants from Austria (7.7%, a difference of 0.15%), Immigrants from Africa (7.7%, a difference of 0.15%), Slavic (7.7%, a difference of 0.15%), and Syrian (7.7%, a difference of 0.19%).
| Demographics | Rating | Rank | Unemployment Among Women with Children Under 6 years |
| Sierra Leoneans | 42.9 /100 | #183 | Average 7.7% |
| Indonesians | 40.5 /100 | #184 | Average 7.7% |
| Spanish Americans | 39.7 /100 | #185 | Fair 7.7% |
| Yugoslavians | 39.4 /100 | #186 | Fair 7.7% |
| Immigrants | Thailand | 38.5 /100 | #187 | Fair 7.7% |
| Czechoslovakians | 38.4 /100 | #188 | Fair 7.7% |
| Immigrants | Panama | 35.7 /100 | #189 | Fair 7.7% |
| Immigrants | North Macedonia | 34.4 /100 | #190 | Fair 7.7% |
| Immigrants | Austria | 32.4 /100 | #191 | Fair 7.7% |
| Immigrants | Africa | 32.4 /100 | #192 | Fair 7.7% |
| Slavs | 32.4 /100 | #193 | Fair 7.7% |
| Syrians | 31.9 /100 | #194 | Fair 7.7% |
| Malaysians | 31.1 /100 | #195 | Fair 7.7% |
| Immigrants | St. Vincent and the Grenadines | 31.1 /100 | #196 | Fair 7.7% |
| Italians | 30.4 /100 | #197 | Fair 7.7% |