Immigrants from Burma/Myanmar vs Immigrants from Jordan Female Unemployment
COMPARE
Immigrants from Burma/Myanmar
Immigrants from Jordan
Female Unemployment
Female Unemployment Comparison
Immigrants from Burma/Myanmar
Immigrants from Jordan
5.1%
FEMALE UNEMPLOYMENT
92.3/ 100
METRIC RATING
111th/ 347
METRIC RANK
5.1%
FEMALE UNEMPLOYMENT
80.4/ 100
METRIC RATING
144th/ 347
METRIC RANK
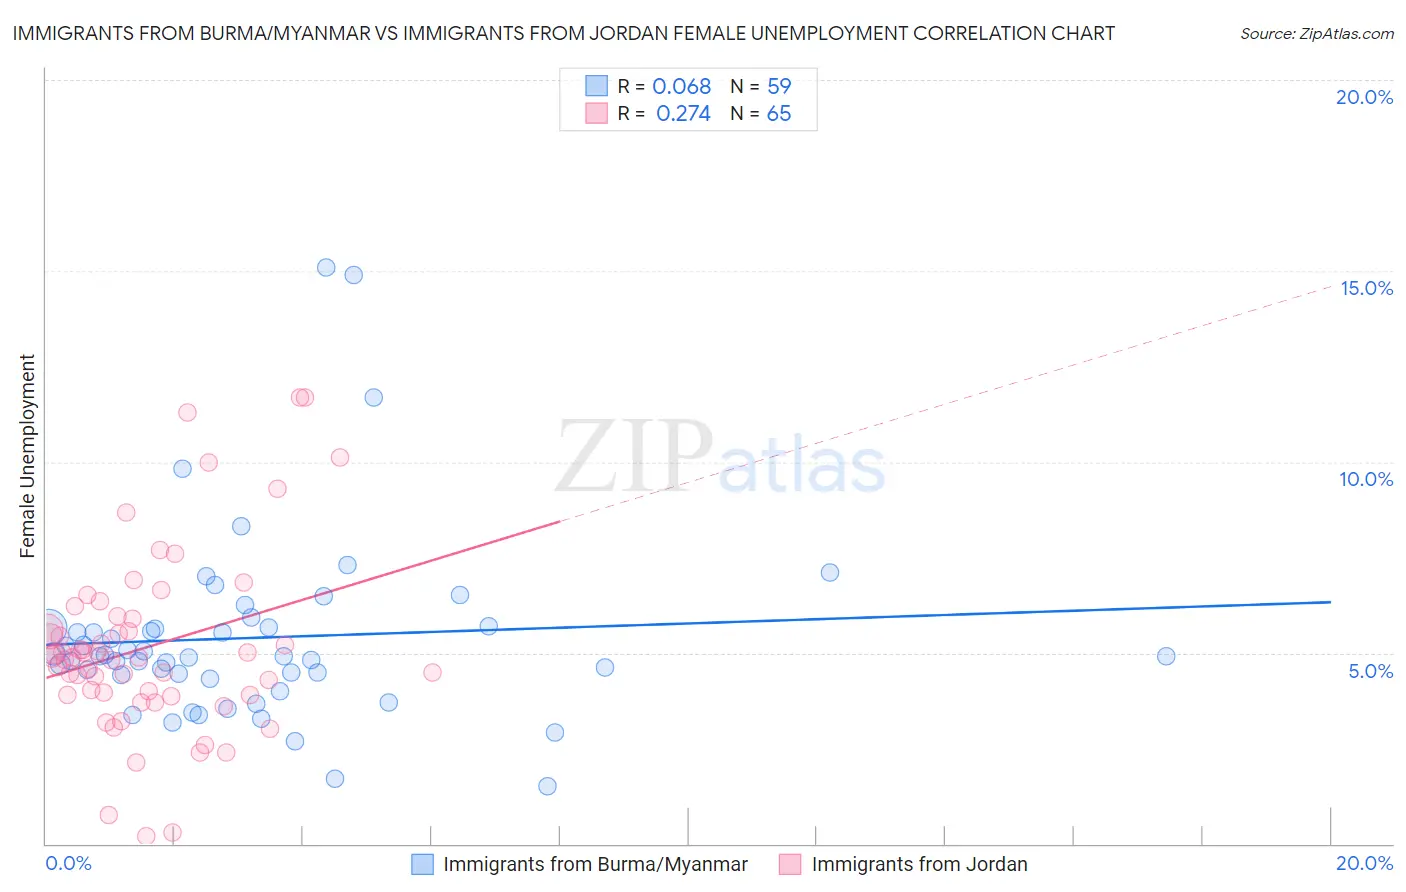
Immigrants from Burma/Myanmar vs Immigrants from Jordan Female Unemployment Correlation Chart
The statistical analysis conducted on geographies consisting of 172,103,877 people shows a slight positive correlation between the proportion of Immigrants from Burma/Myanmar and unemploymnet rate among females in the United States with a correlation coefficient (R) of 0.068 and weighted average of 5.1%. Similarly, the statistical analysis conducted on geographies consisting of 181,116,498 people shows a weak positive correlation between the proportion of Immigrants from Jordan and unemploymnet rate among females in the United States with a correlation coefficient (R) of 0.274 and weighted average of 5.1%, a difference of 1.7%.
Female Unemployment Correlation Summary
| Measurement | Immigrants from Burma/Myanmar | Immigrants from Jordan |
| Minimum | 1.5% | 0.20% |
| Maximum | 15.1% | 11.7% |
| Range | 13.6% | 11.5% |
| Mean | 5.4% | 5.2% |
| Median | 4.9% | 4.9% |
| Interquartile 25% (IQ1) | 4.4% | 3.9% |
| Interquartile 75% (IQ3) | 5.7% | 5.9% |
| Interquartile Range (IQR) | 1.3% | 2.0% |
| Standard Deviation (Sample) | 2.5% | 2.4% |
| Standard Deviation (Population) | 2.4% | 2.4% |
Similar Demographics by Female Unemployment
Demographics Similar to Immigrants from Burma/Myanmar by Female Unemployment
In terms of female unemployment, the demographic groups most similar to Immigrants from Burma/Myanmar are Macedonian (5.1%, a difference of 0.030%), Estonian (5.1%, a difference of 0.030%), Immigrants from Eastern Africa (5.1%, a difference of 0.13%), Puget Sound Salish (5.1%, a difference of 0.17%), and Immigrants from Switzerland (5.1%, a difference of 0.20%).
| Demographics | Rating | Rank | Female Unemployment |
| Kenyans | 93.7 /100 | #104 | Exceptional 5.0% |
| Immigrants | England | 93.6 /100 | #105 | Exceptional 5.0% |
| Paraguayans | 93.2 /100 | #106 | Exceptional 5.1% |
| Immigrants | Switzerland | 93.1 /100 | #107 | Exceptional 5.1% |
| Puget Sound Salish | 93.0 /100 | #108 | Exceptional 5.1% |
| Immigrants | Eastern Africa | 92.8 /100 | #109 | Exceptional 5.1% |
| Macedonians | 92.4 /100 | #110 | Exceptional 5.1% |
| Immigrants | Burma/Myanmar | 92.3 /100 | #111 | Exceptional 5.1% |
| Estonians | 92.1 /100 | #112 | Exceptional 5.1% |
| Immigrants | Saudi Arabia | 91.2 /100 | #113 | Exceptional 5.1% |
| Immigrants | Turkey | 91.0 /100 | #114 | Exceptional 5.1% |
| Lebanese | 91.0 /100 | #115 | Exceptional 5.1% |
| Americans | 90.5 /100 | #116 | Exceptional 5.1% |
| Jordanians | 90.3 /100 | #117 | Exceptional 5.1% |
| Immigrants | Croatia | 89.9 /100 | #118 | Excellent 5.1% |
Demographics Similar to Immigrants from Jordan by Female Unemployment
In terms of female unemployment, the demographic groups most similar to Immigrants from Jordan are Immigrants from Kazakhstan (5.1%, a difference of 0.030%), Palestinian (5.1%, a difference of 0.040%), Immigrants from Oceania (5.2%, a difference of 0.090%), Immigrants from Norway (5.2%, a difference of 0.10%), and Immigrants from Eastern Europe (5.1%, a difference of 0.11%).
| Demographics | Rating | Rank | Female Unemployment |
| Pakistanis | 83.8 /100 | #137 | Excellent 5.1% |
| Chickasaw | 83.2 /100 | #138 | Excellent 5.1% |
| Immigrants | Eastern Asia | 83.0 /100 | #139 | Excellent 5.1% |
| Immigrants | France | 82.7 /100 | #140 | Excellent 5.1% |
| Immigrants | Eastern Europe | 81.5 /100 | #141 | Excellent 5.1% |
| Palestinians | 80.8 /100 | #142 | Excellent 5.1% |
| Immigrants | Kazakhstan | 80.7 /100 | #143 | Excellent 5.1% |
| Immigrants | Jordan | 80.4 /100 | #144 | Excellent 5.1% |
| Immigrants | Oceania | 79.5 /100 | #145 | Good 5.2% |
| Immigrants | Norway | 79.4 /100 | #146 | Good 5.2% |
| Argentineans | 79.2 /100 | #147 | Good 5.2% |
| Immigrants | Argentina | 78.7 /100 | #148 | Good 5.2% |
| Asians | 78.3 /100 | #149 | Good 5.2% |
| Egyptians | 78.3 /100 | #150 | Good 5.2% |
| Immigrants | China | 75.9 /100 | #151 | Good 5.2% |