Immigrants from Brazil vs Immigrants from Australia Unemployment Among Youth under 25 years
COMPARE
Immigrants from Brazil
Immigrants from Australia
Unemployment Among Youth under 25 years
Unemployment Among Youth under 25 years Comparison
Immigrants from Brazil
Immigrants from Australia
11.5%
UNEMPLOYMENT AMONG YOUTH UNDER 25 YEARS
74.3/ 100
METRIC RATING
144th/ 347
METRIC RANK
11.2%
UNEMPLOYMENT AMONG YOUTH UNDER 25 YEARS
97.3/ 100
METRIC RATING
72nd/ 347
METRIC RANK
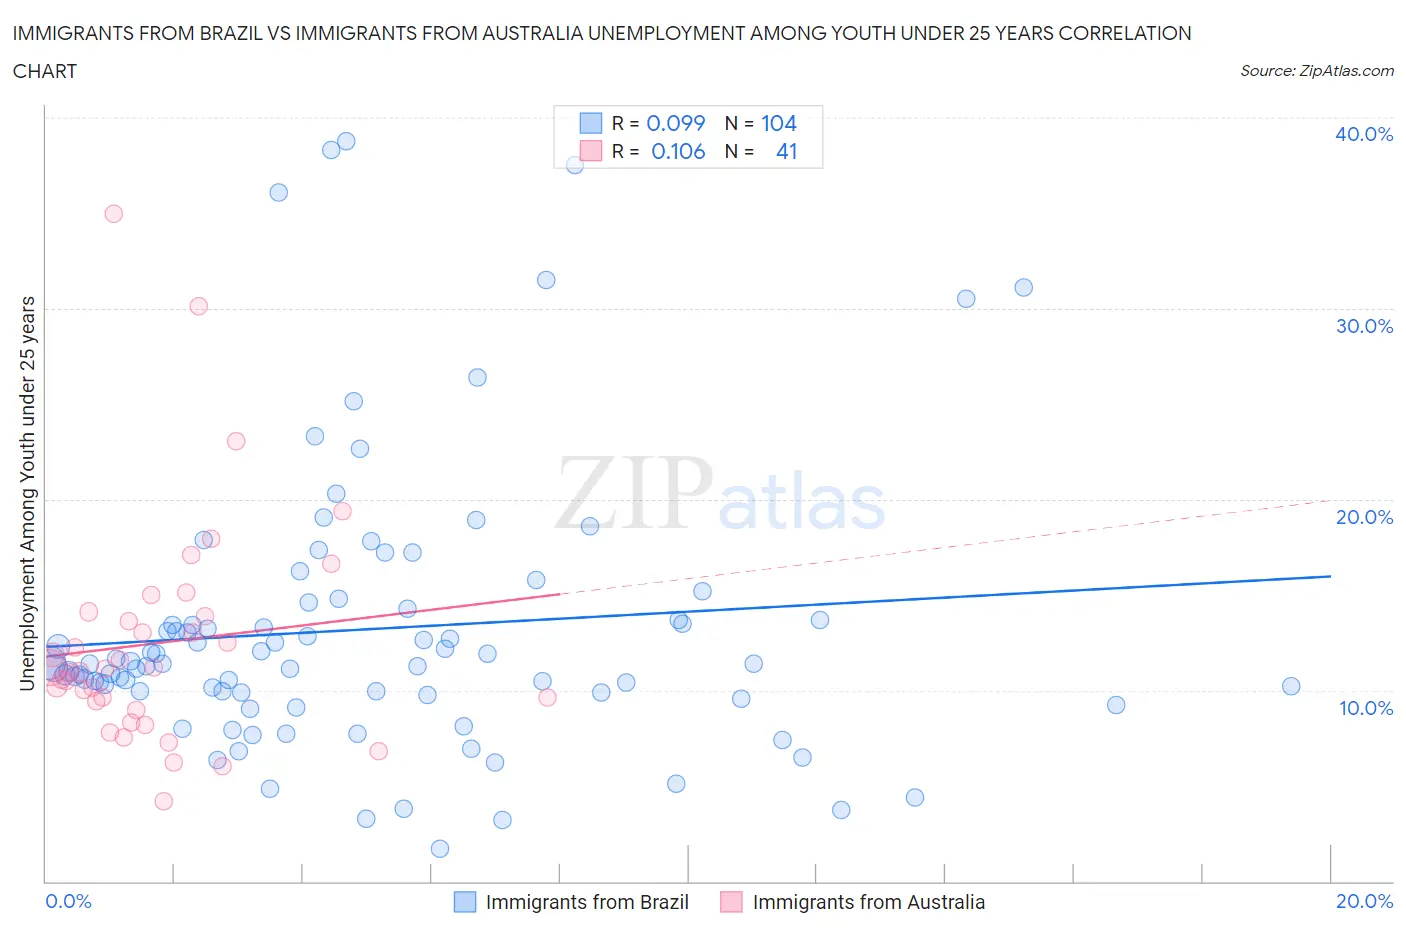
Immigrants from Brazil vs Immigrants from Australia Unemployment Among Youth under 25 years Correlation Chart
The statistical analysis conducted on geographies consisting of 339,963,067 people shows a slight positive correlation between the proportion of Immigrants from Brazil and unemployment rate among youth under the age of 25 in the United States with a correlation coefficient (R) of 0.099 and weighted average of 11.5%. Similarly, the statistical analysis conducted on geographies consisting of 225,367,342 people shows a poor positive correlation between the proportion of Immigrants from Australia and unemployment rate among youth under the age of 25 in the United States with a correlation coefficient (R) of 0.106 and weighted average of 11.2%, a difference of 2.7%.
Unemployment Among Youth under 25 years Correlation Summary
| Measurement | Immigrants from Brazil | Immigrants from Australia |
| Minimum | 1.7% | 4.2% |
| Maximum | 38.8% | 34.9% |
| Range | 37.1% | 30.8% |
| Mean | 13.2% | 12.5% |
| Median | 11.4% | 11.2% |
| Interquartile 25% (IQ1) | 9.9% | 9.2% |
| Interquartile 75% (IQ3) | 14.0% | 14.0% |
| Interquartile Range (IQR) | 4.1% | 4.8% |
| Standard Deviation (Sample) | 7.3% | 6.0% |
| Standard Deviation (Population) | 7.3% | 5.9% |
Similar Demographics by Unemployment Among Youth under 25 years
Demographics Similar to Immigrants from Brazil by Unemployment Among Youth under 25 years
In terms of unemployment among youth under 25 years, the demographic groups most similar to Immigrants from Brazil are Immigrants from Uganda (11.5%, a difference of 0.010%), Immigrants from Korea (11.5%, a difference of 0.050%), Argentinean (11.5%, a difference of 0.070%), Brazilian (11.5%, a difference of 0.090%), and Immigrants from Uruguay (11.5%, a difference of 0.10%).
| Demographics | Rating | Rank | Unemployment Among Youth under 25 years |
| Asians | 79.7 /100 | #137 | Good 11.4% |
| Immigrants | England | 78.1 /100 | #138 | Good 11.5% |
| Immigrants | Indonesia | 77.6 /100 | #139 | Good 11.5% |
| Immigrants | Belgium | 77.5 /100 | #140 | Good 11.5% |
| Immigrants | Uruguay | 76.1 /100 | #141 | Good 11.5% |
| Immigrants | Korea | 75.1 /100 | #142 | Good 11.5% |
| Immigrants | Uganda | 74.5 /100 | #143 | Good 11.5% |
| Immigrants | Brazil | 74.3 /100 | #144 | Good 11.5% |
| Argentineans | 73.0 /100 | #145 | Good 11.5% |
| Brazilians | 72.5 /100 | #146 | Good 11.5% |
| Laotians | 72.4 /100 | #147 | Good 11.5% |
| Immigrants | Northern Europe | 72.1 /100 | #148 | Good 11.5% |
| Immigrants | Cambodia | 71.8 /100 | #149 | Good 11.5% |
| Immigrants | Switzerland | 71.6 /100 | #150 | Good 11.5% |
| Uruguayans | 70.4 /100 | #151 | Good 11.5% |
Demographics Similar to Immigrants from Australia by Unemployment Among Youth under 25 years
In terms of unemployment among youth under 25 years, the demographic groups most similar to Immigrants from Australia are Bhutanese (11.2%, a difference of 0.040%), Creek (11.2%, a difference of 0.050%), New Zealander (11.2%, a difference of 0.060%), Slavic (11.2%, a difference of 0.080%), and Immigrants from Moldova (11.2%, a difference of 0.090%).
| Demographics | Rating | Rank | Unemployment Among Youth under 25 years |
| Immigrants | Singapore | 97.8 /100 | #65 | Exceptional 11.2% |
| Macedonians | 97.7 /100 | #66 | Exceptional 11.2% |
| Chickasaw | 97.7 /100 | #67 | Exceptional 11.2% |
| Immigrants | Kenya | 97.6 /100 | #68 | Exceptional 11.2% |
| Immigrants | Moldova | 97.5 /100 | #69 | Exceptional 11.2% |
| Slavs | 97.5 /100 | #70 | Exceptional 11.2% |
| Bhutanese | 97.4 /100 | #71 | Exceptional 11.2% |
| Immigrants | Australia | 97.3 /100 | #72 | Exceptional 11.2% |
| Creek | 97.2 /100 | #73 | Exceptional 11.2% |
| New Zealanders | 97.2 /100 | #74 | Exceptional 11.2% |
| French | 97.1 /100 | #75 | Exceptional 11.2% |
| German Russians | 97.0 /100 | #76 | Exceptional 11.2% |
| Whites/Caucasians | 96.9 /100 | #77 | Exceptional 11.2% |
| Immigrants | Nicaragua | 96.7 /100 | #78 | Exceptional 11.2% |
| Immigrants | Canada | 96.7 /100 | #79 | Exceptional 11.2% |