Immigrants from Bosnia and Herzegovina vs West Indian Unemployment Among Women with Children Under 18 years
COMPARE
Immigrants from Bosnia and Herzegovina
West Indian
Unemployment Among Women with Children Under 18 years
Unemployment Among Women with Children Under 18 years Comparison
Immigrants from Bosnia and Herzegovina
West Indians
5.0%
UNEMPLOYMENT AMONG WOMEN WITH CHILDREN UNDER 18 YEARS
99.0/ 100
METRIC RATING
41st/ 347
METRIC RANK
6.3%
UNEMPLOYMENT AMONG WOMEN WITH CHILDREN UNDER 18 YEARS
0.0/ 100
METRIC RATING
283rd/ 347
METRIC RANK
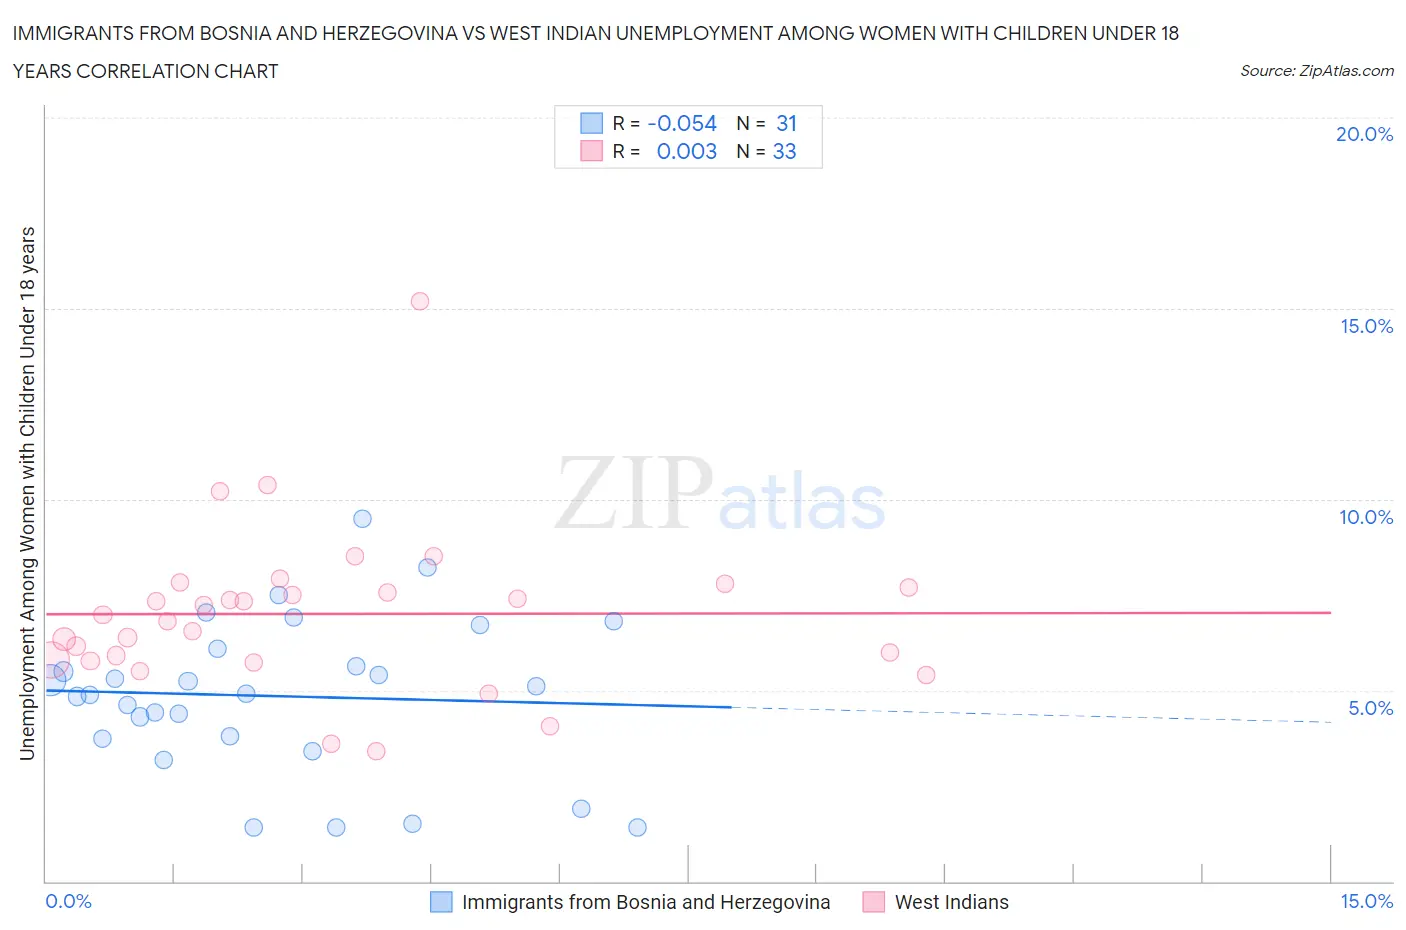
Immigrants from Bosnia and Herzegovina vs West Indian Unemployment Among Women with Children Under 18 years Correlation Chart
The statistical analysis conducted on geographies consisting of 154,290,483 people shows a slight negative correlation between the proportion of Immigrants from Bosnia and Herzegovina and unemployment rate among women with children under the age of 18 in the United States with a correlation coefficient (R) of -0.054 and weighted average of 5.0%. Similarly, the statistical analysis conducted on geographies consisting of 249,152,144 people shows no correlation between the proportion of West Indians and unemployment rate among women with children under the age of 18 in the United States with a correlation coefficient (R) of 0.003 and weighted average of 6.3%, a difference of 26.1%.
Unemployment Among Women with Children Under 18 years Correlation Summary
| Measurement | Immigrants from Bosnia and Herzegovina | West Indian |
| Minimum | 1.4% | 3.4% |
| Maximum | 9.5% | 15.2% |
| Range | 8.1% | 11.8% |
| Mean | 4.8% | 7.0% |
| Median | 4.9% | 7.0% |
| Interquartile 25% (IQ1) | 3.7% | 5.8% |
| Interquartile 75% (IQ3) | 6.1% | 7.7% |
| Interquartile Range (IQR) | 2.3% | 2.0% |
| Standard Deviation (Sample) | 2.0% | 2.2% |
| Standard Deviation (Population) | 2.0% | 2.1% |
Similar Demographics by Unemployment Among Women with Children Under 18 years
Demographics Similar to Immigrants from Bosnia and Herzegovina by Unemployment Among Women with Children Under 18 years
In terms of unemployment among women with children under 18 years, the demographic groups most similar to Immigrants from Bosnia and Herzegovina are Greek (5.0%, a difference of 0.060%), Eastern European (5.0%, a difference of 0.080%), Turkish (5.0%, a difference of 0.13%), Immigrants from Moldova (5.0%, a difference of 0.19%), and Immigrants from Malaysia (5.0%, a difference of 0.27%).
| Demographics | Rating | Rank | Unemployment Among Women with Children Under 18 years |
| Immigrants | South Central Asia | 99.2 /100 | #34 | Exceptional 5.0% |
| Luxembourgers | 99.2 /100 | #35 | Exceptional 5.0% |
| Mongolians | 99.2 /100 | #36 | Exceptional 5.0% |
| Poles | 99.2 /100 | #37 | Exceptional 5.0% |
| Bhutanese | 99.2 /100 | #38 | Exceptional 5.0% |
| English | 99.1 /100 | #39 | Exceptional 5.0% |
| Greeks | 99.0 /100 | #40 | Exceptional 5.0% |
| Immigrants | Bosnia and Herzegovina | 99.0 /100 | #41 | Exceptional 5.0% |
| Eastern Europeans | 98.9 /100 | #42 | Exceptional 5.0% |
| Turks | 98.9 /100 | #43 | Exceptional 5.0% |
| Immigrants | Moldova | 98.9 /100 | #44 | Exceptional 5.0% |
| Immigrants | Malaysia | 98.8 /100 | #45 | Exceptional 5.0% |
| Immigrants | Korea | 98.7 /100 | #46 | Exceptional 5.0% |
| British | 98.7 /100 | #47 | Exceptional 5.0% |
| Northern Europeans | 98.6 /100 | #48 | Exceptional 5.0% |
Demographics Similar to West Indians by Unemployment Among Women with Children Under 18 years
In terms of unemployment among women with children under 18 years, the demographic groups most similar to West Indians are Immigrants from Grenada (6.3%, a difference of 0.030%), Immigrants from St. Vincent and the Grenadines (6.3%, a difference of 0.18%), Bahamian (6.3%, a difference of 0.18%), Immigrants from El Salvador (6.3%, a difference of 0.19%), and Alaskan Athabascan (6.3%, a difference of 0.33%).
| Demographics | Rating | Rank | Unemployment Among Women with Children Under 18 years |
| Immigrants | Ghana | 0.0 /100 | #276 | Tragic 6.2% |
| Mexican American Indians | 0.0 /100 | #277 | Tragic 6.2% |
| Immigrants | Barbados | 0.0 /100 | #278 | Tragic 6.2% |
| Immigrants | Portugal | 0.0 /100 | #279 | Tragic 6.3% |
| Guatemalans | 0.0 /100 | #280 | Tragic 6.3% |
| Immigrants | El Salvador | 0.0 /100 | #281 | Tragic 6.3% |
| Immigrants | St. Vincent and the Grenadines | 0.0 /100 | #282 | Tragic 6.3% |
| West Indians | 0.0 /100 | #283 | Tragic 6.3% |
| Immigrants | Grenada | 0.0 /100 | #284 | Tragic 6.3% |
| Bahamians | 0.0 /100 | #285 | Tragic 6.3% |
| Alaskan Athabascans | 0.0 /100 | #286 | Tragic 6.3% |
| Kiowa | 0.0 /100 | #287 | Tragic 6.3% |
| Cree | 0.0 /100 | #288 | Tragic 6.3% |
| Immigrants | Caribbean | 0.0 /100 | #289 | Tragic 6.4% |
| Blackfeet | 0.0 /100 | #290 | Tragic 6.4% |