Immigrants from Bosnia and Herzegovina vs Immigrants from Venezuela Unemployment Among Ages 60 to 64 years
COMPARE
Immigrants from Bosnia and Herzegovina
Immigrants from Venezuela
Unemployment Among Ages 60 to 64 years
Unemployment Among Ages 60 to 64 years Comparison
Immigrants from Bosnia and Herzegovina
Immigrants from Venezuela
4.2%
UNEMPLOYMENT AMONG AGES 60 TO 64 YEARS
100.0/ 100
METRIC RATING
10th/ 347
METRIC RANK
4.5%
UNEMPLOYMENT AMONG AGES 60 TO 64 YEARS
100.0/ 100
METRIC RATING
30th/ 347
METRIC RANK
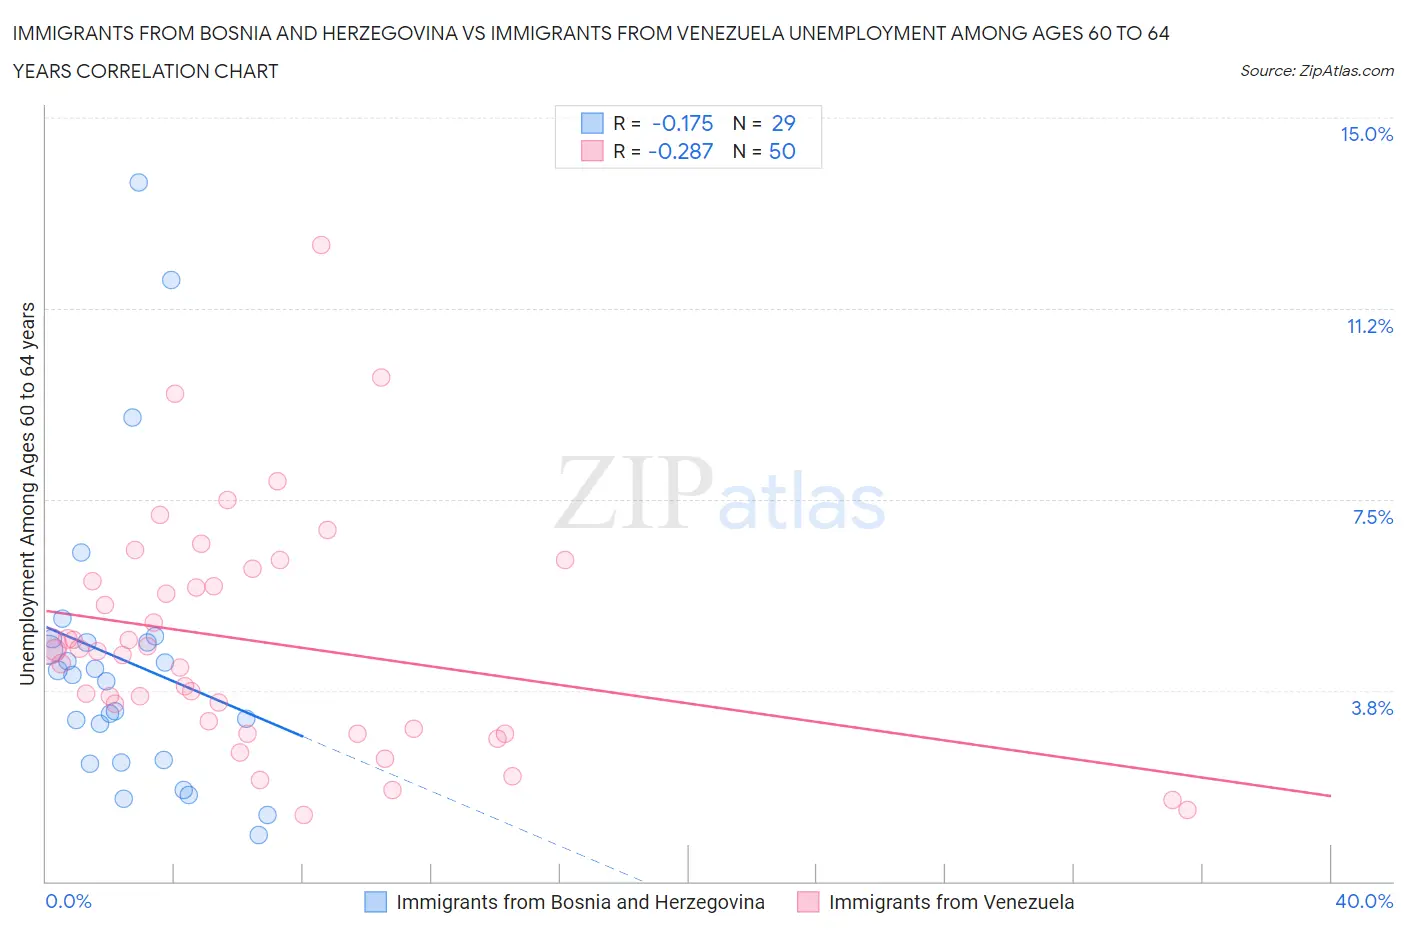
Immigrants from Bosnia and Herzegovina vs Immigrants from Venezuela Unemployment Among Ages 60 to 64 years Correlation Chart
The statistical analysis conducted on geographies consisting of 149,200,832 people shows a poor negative correlation between the proportion of Immigrants from Bosnia and Herzegovina and unemployment rate among population between the ages 60 and 64 in the United States with a correlation coefficient (R) of -0.175 and weighted average of 4.2%. Similarly, the statistical analysis conducted on geographies consisting of 269,107,059 people shows a weak negative correlation between the proportion of Immigrants from Venezuela and unemployment rate among population between the ages 60 and 64 in the United States with a correlation coefficient (R) of -0.287 and weighted average of 4.5%, a difference of 5.2%.
Unemployment Among Ages 60 to 64 years Correlation Summary
| Measurement | Immigrants from Bosnia and Herzegovina | Immigrants from Venezuela |
| Minimum | 0.90% | 1.3% |
| Maximum | 13.7% | 12.5% |
| Range | 12.8% | 11.2% |
| Mean | 4.3% | 4.7% |
| Median | 4.0% | 4.5% |
| Interquartile 25% (IQ1) | 2.4% | 3.0% |
| Interquartile 75% (IQ3) | 4.7% | 5.9% |
| Interquartile Range (IQR) | 2.4% | 2.9% |
| Standard Deviation (Sample) | 2.9% | 2.3% |
| Standard Deviation (Population) | 2.8% | 2.2% |
Demographics Similar to Immigrants from Bosnia and Herzegovina and Immigrants from Venezuela by Unemployment Among Ages 60 to 64 years
In terms of unemployment among ages 60 to 64 years, the demographic groups most similar to Immigrants from Bosnia and Herzegovina are Luxembourger (4.3%, a difference of 0.74%), Immigrants from Cuba (4.3%, a difference of 1.8%), Chickasaw (4.3%, a difference of 1.8%), Norwegian (4.3%, a difference of 1.8%), and Sudanese (4.3%, a difference of 2.4%). Similarly, the demographic groups most similar to Immigrants from Venezuela are Cuban (4.5%, a difference of 0.020%), Immigrants from Nepal (4.5%, a difference of 0.25%), Immigrants from Iraq (4.5%, a difference of 0.33%), Czech (4.4%, a difference of 0.41%), and Yugoslavian (4.4%, a difference of 0.51%).
| Demographics | Rating | Rank | Unemployment Among Ages 60 to 64 years |
| Immigrants | Bosnia and Herzegovina | 100.0 /100 | #10 | Exceptional 4.2% |
| Luxembourgers | 100.0 /100 | #11 | Exceptional 4.3% |
| Immigrants | Cuba | 100.0 /100 | #12 | Exceptional 4.3% |
| Chickasaw | 100.0 /100 | #13 | Exceptional 4.3% |
| Norwegians | 100.0 /100 | #14 | Exceptional 4.3% |
| Sudanese | 100.0 /100 | #15 | Exceptional 4.3% |
| Danes | 100.0 /100 | #16 | Exceptional 4.4% |
| Immigrants | Afghanistan | 100.0 /100 | #17 | Exceptional 4.4% |
| Slovenes | 100.0 /100 | #18 | Exceptional 4.4% |
| Tsimshian | 100.0 /100 | #19 | Exceptional 4.4% |
| Afghans | 100.0 /100 | #20 | Exceptional 4.4% |
| Immigrants | Cabo Verde | 100.0 /100 | #21 | Exceptional 4.4% |
| Cape Verdeans | 100.0 /100 | #22 | Exceptional 4.4% |
| Immigrants | Zaire | 100.0 /100 | #23 | Exceptional 4.4% |
| Immigrants | Burma/Myanmar | 100.0 /100 | #24 | Exceptional 4.4% |
| Yugoslavians | 100.0 /100 | #25 | Exceptional 4.4% |
| Czechs | 100.0 /100 | #26 | Exceptional 4.4% |
| Immigrants | Iraq | 100.0 /100 | #27 | Exceptional 4.5% |
| Immigrants | Nepal | 100.0 /100 | #28 | Exceptional 4.5% |
| Cubans | 100.0 /100 | #29 | Exceptional 4.5% |
| Immigrants | Venezuela | 100.0 /100 | #30 | Exceptional 4.5% |