Immigrants from Bosnia and Herzegovina vs Immigrants from Cameroon Unemployment Among Ages 16 to 19 years
COMPARE
Immigrants from Bosnia and Herzegovina
Immigrants from Cameroon
Unemployment Among Ages 16 to 19 years
Unemployment Among Ages 16 to 19 years Comparison
Immigrants from Bosnia and Herzegovina
Immigrants from Cameroon
15.3%
UNEMPLOYMENT AMONG AGES 16 TO 19 YEARS
100.0/ 100
METRIC RATING
7th/ 347
METRIC RANK
18.8%
UNEMPLOYMENT AMONG AGES 16 TO 19 YEARS
0.3/ 100
METRIC RATING
255th/ 347
METRIC RANK
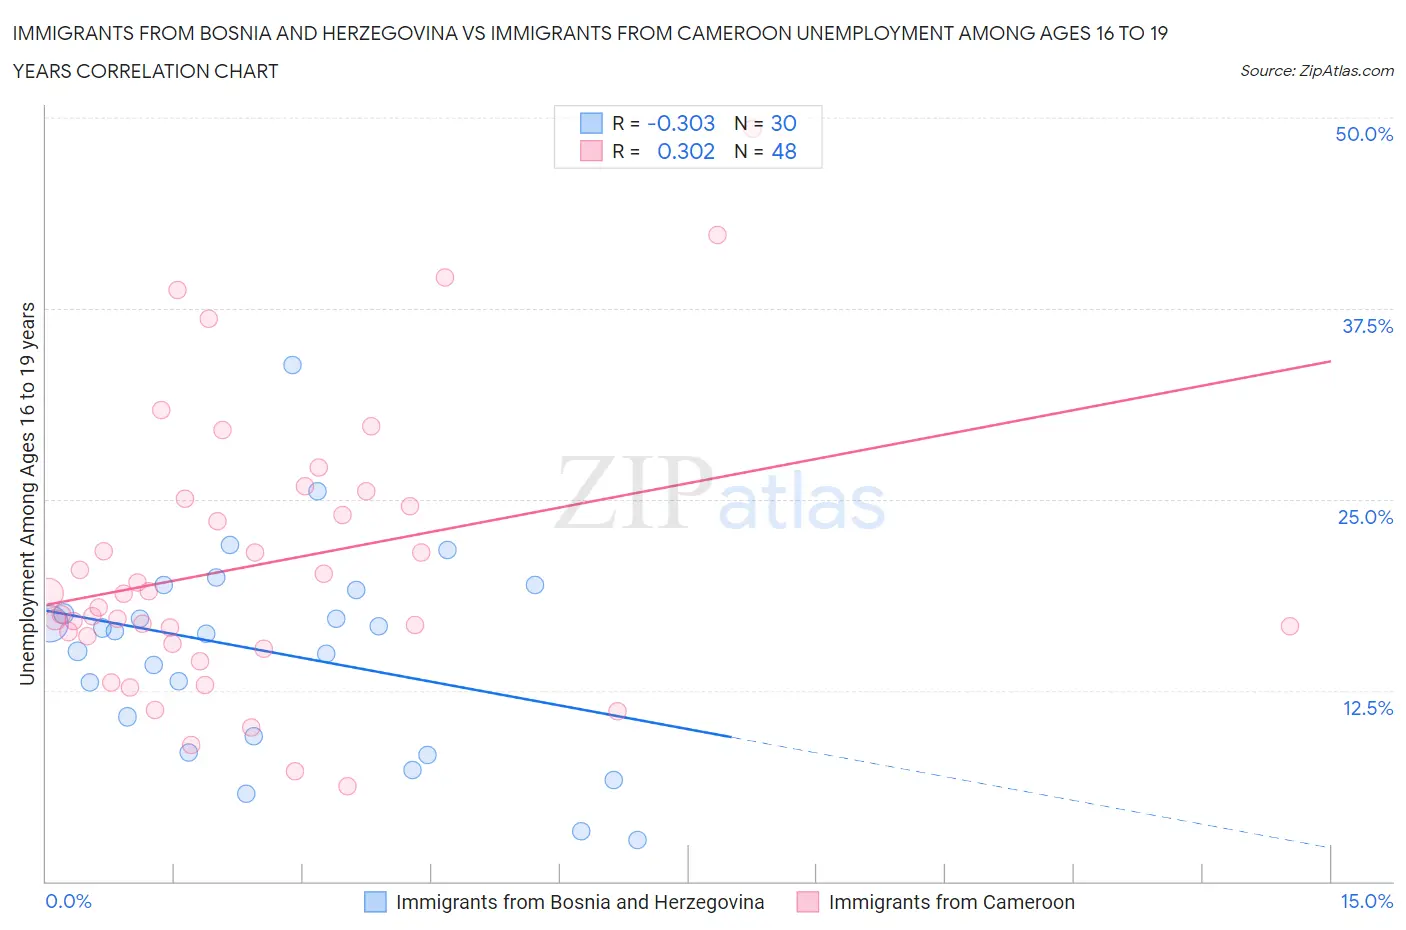
Immigrants from Bosnia and Herzegovina vs Immigrants from Cameroon Unemployment Among Ages 16 to 19 years Correlation Chart
The statistical analysis conducted on geographies consisting of 153,076,834 people shows a mild negative correlation between the proportion of Immigrants from Bosnia and Herzegovina and unemployment rate among population between the ages 16 and 19 in the United States with a correlation coefficient (R) of -0.303 and weighted average of 15.3%. Similarly, the statistical analysis conducted on geographies consisting of 128,803,967 people shows a mild positive correlation between the proportion of Immigrants from Cameroon and unemployment rate among population between the ages 16 and 19 in the United States with a correlation coefficient (R) of 0.302 and weighted average of 18.8%, a difference of 22.5%.
Unemployment Among Ages 16 to 19 years Correlation Summary
| Measurement | Immigrants from Bosnia and Herzegovina | Immigrants from Cameroon |
| Minimum | 2.7% | 6.2% |
| Maximum | 33.8% | 49.3% |
| Range | 31.1% | 43.1% |
| Mean | 14.9% | 20.7% |
| Median | 16.3% | 18.4% |
| Interquartile 25% (IQ1) | 9.5% | 15.8% |
| Interquartile 75% (IQ3) | 19.1% | 24.8% |
| Interquartile Range (IQR) | 9.6% | 9.0% |
| Standard Deviation (Sample) | 6.7% | 9.1% |
| Standard Deviation (Population) | 6.6% | 9.0% |
Similar Demographics by Unemployment Among Ages 16 to 19 years
Demographics Similar to Immigrants from Bosnia and Herzegovina by Unemployment Among Ages 16 to 19 years
In terms of unemployment among ages 16 to 19 years, the demographic groups most similar to Immigrants from Bosnia and Herzegovina are Swedish (15.3%, a difference of 0.17%), Czech (15.4%, a difference of 0.24%), Immigrants from Somalia (15.3%, a difference of 0.44%), Scandinavian (15.4%, a difference of 0.57%), and Zimbabwean (15.4%, a difference of 0.68%).
| Demographics | Rating | Rank | Unemployment Among Ages 16 to 19 years |
| Norwegians | 100.0 /100 | #1 | Exceptional 14.5% |
| Immigrants | India | 100.0 /100 | #2 | Exceptional 15.0% |
| Luxembourgers | 100.0 /100 | #3 | Exceptional 15.1% |
| Danes | 100.0 /100 | #4 | Exceptional 15.2% |
| Immigrants | Somalia | 100.0 /100 | #5 | Exceptional 15.3% |
| Swedes | 100.0 /100 | #6 | Exceptional 15.3% |
| Immigrants | Bosnia and Herzegovina | 100.0 /100 | #7 | Exceptional 15.3% |
| Czechs | 100.0 /100 | #8 | Exceptional 15.4% |
| Scandinavians | 100.0 /100 | #9 | Exceptional 15.4% |
| Zimbabweans | 100.0 /100 | #10 | Exceptional 15.4% |
| Indonesians | 100.0 /100 | #11 | Exceptional 15.5% |
| Taiwanese | 100.0 /100 | #12 | Exceptional 15.5% |
| Immigrants | Burma/Myanmar | 100.0 /100 | #13 | Exceptional 15.6% |
| Immigrants | Zaire | 100.0 /100 | #14 | Exceptional 15.6% |
| Yugoslavians | 100.0 /100 | #15 | Exceptional 15.6% |
Demographics Similar to Immigrants from Cameroon by Unemployment Among Ages 16 to 19 years
In terms of unemployment among ages 16 to 19 years, the demographic groups most similar to Immigrants from Cameroon are Apache (18.8%, a difference of 0.010%), Central American (18.8%, a difference of 0.040%), Mexican American Indian (18.8%, a difference of 0.070%), Immigrants from Nigeria (18.9%, a difference of 0.33%), and Immigrants from Guatemala (18.7%, a difference of 0.34%).
| Demographics | Rating | Rank | Unemployment Among Ages 16 to 19 years |
| Delaware | 0.5 /100 | #248 | Tragic 18.7% |
| Puget Sound Salish | 0.5 /100 | #249 | Tragic 18.7% |
| Panamanians | 0.4 /100 | #250 | Tragic 18.7% |
| Sub-Saharan Africans | 0.4 /100 | #251 | Tragic 18.7% |
| Immigrants | Guatemala | 0.4 /100 | #252 | Tragic 18.7% |
| Central Americans | 0.3 /100 | #253 | Tragic 18.8% |
| Apache | 0.3 /100 | #254 | Tragic 18.8% |
| Immigrants | Cameroon | 0.3 /100 | #255 | Tragic 18.8% |
| Mexican American Indians | 0.3 /100 | #256 | Tragic 18.8% |
| Immigrants | Nigeria | 0.2 /100 | #257 | Tragic 18.9% |
| Immigrants | Mexico | 0.2 /100 | #258 | Tragic 18.9% |
| Immigrants | Central America | 0.2 /100 | #259 | Tragic 18.9% |
| Nigerians | 0.2 /100 | #260 | Tragic 18.9% |
| Spanish American Indians | 0.1 /100 | #261 | Tragic 18.9% |
| Salvadorans | 0.1 /100 | #262 | Tragic 18.9% |