Immigrants from Bosnia and Herzegovina vs Colville Unemployment
COMPARE
Immigrants from Bosnia and Herzegovina
Colville
Unemployment
Unemployment Comparison
Immigrants from Bosnia and Herzegovina
Colville
4.8%
UNEMPLOYMENT
99.7/ 100
METRIC RATING
41st/ 347
METRIC RANK
6.6%
UNEMPLOYMENT
0.0/ 100
METRIC RATING
312th/ 347
METRIC RANK
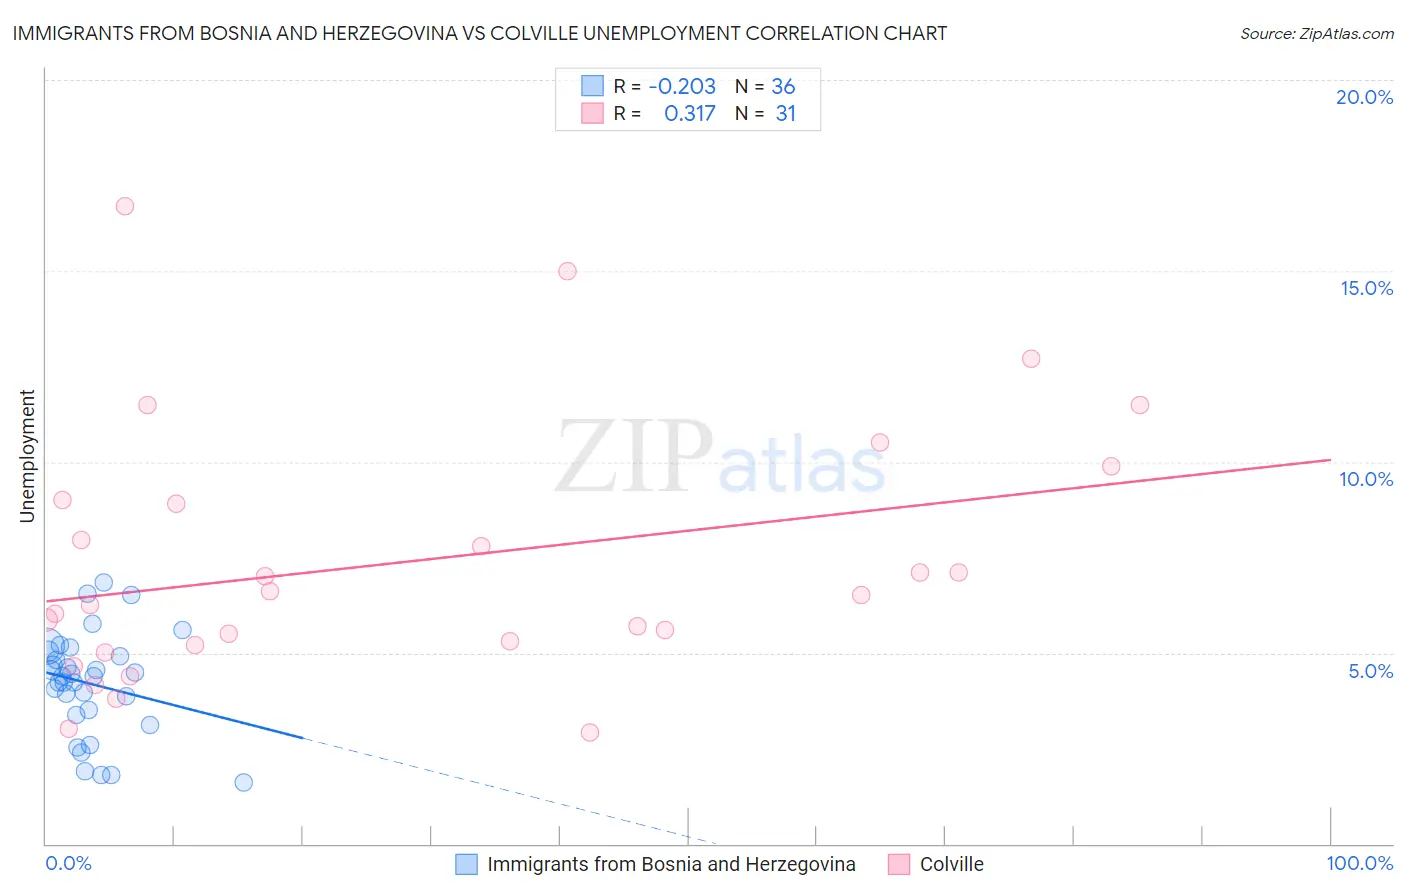
Immigrants from Bosnia and Herzegovina vs Colville Unemployment Correlation Chart
The statistical analysis conducted on geographies consisting of 156,781,298 people shows a weak negative correlation between the proportion of Immigrants from Bosnia and Herzegovina and unemployment in the United States with a correlation coefficient (R) of -0.203 and weighted average of 4.8%. Similarly, the statistical analysis conducted on geographies consisting of 34,675,469 people shows a mild positive correlation between the proportion of Colville and unemployment in the United States with a correlation coefficient (R) of 0.317 and weighted average of 6.6%, a difference of 36.9%.
Unemployment Correlation Summary
| Measurement | Immigrants from Bosnia and Herzegovina | Colville |
| Minimum | 1.6% | 2.9% |
| Maximum | 6.8% | 16.7% |
| Range | 5.2% | 13.8% |
| Mean | 4.2% | 7.4% |
| Median | 4.4% | 6.5% |
| Interquartile 25% (IQ1) | 3.4% | 5.2% |
| Interquartile 75% (IQ3) | 5.0% | 9.0% |
| Interquartile Range (IQR) | 1.6% | 3.8% |
| Standard Deviation (Sample) | 1.3% | 3.4% |
| Standard Deviation (Population) | 1.3% | 3.3% |
Similar Demographics by Unemployment
Demographics Similar to Immigrants from Bosnia and Herzegovina by Unemployment
In terms of unemployment, the demographic groups most similar to Immigrants from Bosnia and Herzegovina are Northern European (4.8%, a difference of 0.030%), Lithuanian (4.8%, a difference of 0.040%), Bolivian (4.8%, a difference of 0.19%), Czechoslovakian (4.8%, a difference of 0.38%), and Tongan (4.8%, a difference of 0.45%).
| Demographics | Rating | Rank | Unemployment |
| Immigrants | Bolivia | 99.8 /100 | #34 | Exceptional 4.8% |
| Scotch-Irish | 99.8 /100 | #35 | Exceptional 4.8% |
| Tongans | 99.7 /100 | #36 | Exceptional 4.8% |
| Czechoslovakians | 99.7 /100 | #37 | Exceptional 4.8% |
| Bolivians | 99.7 /100 | #38 | Exceptional 4.8% |
| Lithuanians | 99.7 /100 | #39 | Exceptional 4.8% |
| Northern Europeans | 99.7 /100 | #40 | Exceptional 4.8% |
| Immigrants | Bosnia and Herzegovina | 99.7 /100 | #41 | Exceptional 4.8% |
| Filipinos | 99.5 /100 | #42 | Exceptional 4.8% |
| Yugoslavians | 99.5 /100 | #43 | Exceptional 4.8% |
| Austrians | 99.5 /100 | #44 | Exceptional 4.8% |
| French | 99.5 /100 | #45 | Exceptional 4.8% |
| Immigrants | Nepal | 99.4 /100 | #46 | Exceptional 4.8% |
| Immigrants | Taiwan | 99.4 /100 | #47 | Exceptional 4.8% |
| Immigrants | Scotland | 99.3 /100 | #48 | Exceptional 4.9% |
Demographics Similar to Colville by Unemployment
In terms of unemployment, the demographic groups most similar to Colville are Immigrants from Barbados (6.6%, a difference of 0.38%), Cape Verdean (6.5%, a difference of 0.57%), Immigrants from Belize (6.5%, a difference of 0.91%), Black/African American (6.6%, a difference of 0.93%), and Vietnamese (6.5%, a difference of 1.2%).
| Demographics | Rating | Rank | Unemployment |
| Menominee | 0.0 /100 | #305 | Tragic 6.4% |
| Lumbee | 0.0 /100 | #306 | Tragic 6.4% |
| Immigrants | Bangladesh | 0.0 /100 | #307 | Tragic 6.5% |
| Barbadians | 0.0 /100 | #308 | Tragic 6.5% |
| Vietnamese | 0.0 /100 | #309 | Tragic 6.5% |
| Immigrants | Belize | 0.0 /100 | #310 | Tragic 6.5% |
| Cape Verdeans | 0.0 /100 | #311 | Tragic 6.5% |
| Colville | 0.0 /100 | #312 | Tragic 6.6% |
| Immigrants | Barbados | 0.0 /100 | #313 | Tragic 6.6% |
| Blacks/African Americans | 0.0 /100 | #314 | Tragic 6.6% |
| Houma | 0.0 /100 | #315 | Tragic 6.7% |
| Immigrants | Dominica | 0.0 /100 | #316 | Tragic 6.7% |
| Shoshone | 0.0 /100 | #317 | Tragic 6.8% |
| Immigrants | Cabo Verde | 0.0 /100 | #318 | Tragic 6.8% |
| British West Indians | 0.0 /100 | #319 | Tragic 6.8% |