Immigrants from Bosnia and Herzegovina vs Argentinean Unemployment Among Ages 65 to 74 years

COMPARE

Immigrants from Bosnia and Herzegovina
Race
Ancestry
AfghanAfricanAlaska NativeAlaskan AthabascanAlbanianAleutAlsatianAmericanApacheArabArapahoArmenianAssyrian/Chaldean/SyriacAustralianAustrianBahamianBangladeshiBarbadianBasqueBelgianBelizeanBermudanBhutaneseBlackfeetBolivianBrazilianBritishBritish West IndianBulgarianBurmeseCajunCambodianCanadianCape VerdeanCarpatho RusynCelticCentral AmericanCentral American IndianCherokeeCheyenneChickasawChileanChineseChippewaChoctawColombianColvilleComancheCosta RicanCreeCreekCroatianCrowCubanCypriotCzechCzechoslovakianDanishDelawareDominicanDutchDutch West IndianEastern EuropeanEcuadorianEgyptianEnglishEstonianEthiopianEuropeanFijianFilipinoFinnishFrenchFrench American IndianFrench CanadianGermanGerman RussianGhanaianGreekGuamanian/ChamorroGuatemalanGuyaneseHaitianHmongHonduranHopiHoumaHungarianIcelanderIndian (Asian)IndonesianInupiatIranianIraqiIrishIroquoisIsraeliItalianJamaicanJapaneseJordanianKenyanKiowaKoreanLaotianLatvianLebaneseLiberianLithuanianLumbeeLuxembourgerMacedonianMalaysianMalteseMarshalleseMenomineeMexicanMexican American IndianMongolianMoroccanNative HawaiianNavajoNepaleseNew ZealanderNicaraguanNigerianNorthern EuropeanNorwegianOkinawanOsageOttawaPaiutePakistaniPalestinianPanamanianParaguayanPennsylvania GermanPeruvianPimaPolishPortuguesePotawatomiPuebloPuerto RicanPuget Sound SalishRomanianRussianSalvadoranSamoanScandinavianScotch-IrishScottishSeminoleSenegaleseSerbianShoshoneSierra LeoneanSiouxSlavicSlovakSloveneSomaliSouth AfricanSouth AmericanSouth American IndianSoviet UnionSpaniardSpanishSpanish AmericanSpanish American IndianSri LankanSubsaharan AfricanSudaneseSwedishSwissSyrianTaiwaneseThaiTlingit-HaidaTohono O'OdhamTonganTrinidadian and TobagonianTsimshianTurkishU.S. Virgin IslanderUgandanUkrainianUruguayanUteVenezuelanVietnameseWelshWest IndianYakamaYaquiYugoslavianYumanYup'ikZimbabwean
Immigration
NonimmigrantsImmigrantsAfghanistanAfricaAlbaniaArgentinaArmeniaAsiaAustraliaAustriaBahamasBangladeshBarbadosBelarusBelgiumBelizeBoliviaBosnia and HerzegovinaBrazilBulgariaBurma/MyanmarCabo VerdeCambodiaCameroonCanadaCaribbeanCentral AmericaChileChinaColombiaCongoCosta RicaCroatiaCubaCzechoslovakiaDenmarkDominicaDominican RepublicEastern AfricaEastern AsiaEastern EuropeEcuadorEgyptEl SalvadorEnglandEritreaEthiopiaEuropeFijiFranceGermanyGhanaGreeceGrenadaGuatemalaGuyanaHaitiHondurasHong KongHungaryIndiaIndonesiaIranIraqIrelandIsraelItalyJamaicaJapanJordanKazakhstanKenyaKoreaKuwaitLaosLatin AmericaLatviaLebanonLiberiaLithuaniaMalaysiaMexicoMicronesiaMiddle AfricaMoldovaMoroccoNepalNetherlandsNicaraguaNigeriaNorth AmericaNorth MacedoniaNorthern AfricaNorthern EuropeNorwayOceaniaPakistanPanamaPeruPhilippinesPolandPortugalRomaniaRussiaSaudi ArabiaScotlandSenegalSerbiaSierra LeoneSingaporeSomaliaSouth AfricaSouth AmericaSouth Central AsiaSouth Eastern AsiaSouthern EuropeSpainSri LankaSt. Vincent and the GrenadinesSudanSwedenSwitzerlandSyriaTaiwanThailandTrinidad and TobagoTurkeyUgandaUkraineUruguayUzbekistanVenezuelaVietnamWest IndiesWestern AfricaWestern AsiaWestern EuropeYemenZaireZimbabweAzores
Argentinean
Race
Ancestry
AfghanAfricanAlaska NativeAlaskan AthabascanAlbanianAleutAlsatianAmericanApacheArabArapahoArgentineanArmenianAssyrian/Chaldean/SyriacAustralianAustrianBahamianBangladeshiBarbadianBasqueBelgianBelizeanBermudanBhutaneseBlackfeetBolivianBrazilianBritishBritish West IndianBulgarianBurmeseCajunCambodianCanadianCape VerdeanCarpatho RusynCelticCentral AmericanCentral American IndianCherokeeCheyenneChickasawChileanChineseChippewaChoctawColombianColvilleComancheCosta RicanCreeCreekCroatianCrowCubanCypriotCzechCzechoslovakianDanishDelawareDominicanDutchDutch West IndianEastern EuropeanEcuadorianEgyptianEnglishEstonianEthiopianEuropeanFijianFilipinoFinnishFrenchFrench American IndianFrench CanadianGermanGerman RussianGhanaianGreekGuamanian/ChamorroGuatemalanGuyaneseHaitianHmongHonduranHopiHoumaHungarianIcelanderIndian (Asian)IndonesianInupiatIranianIraqiIrishIroquoisIsraeliItalianJamaicanJapaneseJordanianKenyanKiowaKoreanLaotianLatvianLebaneseLiberianLithuanianLumbeeLuxembourgerMacedonianMalaysianMalteseMarshalleseMenomineeMexicanMexican American IndianMongolianMoroccanNative HawaiianNavajoNepaleseNew ZealanderNicaraguanNigerianNorthern EuropeanNorwegianOkinawanOsageOttawaPaiutePakistaniPalestinianPanamanianParaguayanPennsylvania GermanPeruvianPimaPolishPortuguesePotawatomiPuebloPuerto RicanPuget Sound SalishRomanianRussianSalvadoranSamoanScandinavianScotch-IrishScottishSeminoleSenegaleseSerbianShoshoneSierra LeoneanSiouxSlavicSlovakSloveneSomaliSouth AfricanSouth AmericanSouth American IndianSoviet UnionSpaniardSpanishSpanish AmericanSpanish American IndianSri LankanSubsaharan AfricanSudaneseSwedishSwissSyrianTaiwaneseThaiTlingit-HaidaTohono O'OdhamTonganTrinidadian and TobagonianTsimshianTurkishU.S. Virgin IslanderUgandanUkrainianUruguayanUteVenezuelanVietnameseWelshWest IndianYakamaYaquiYugoslavianYumanYup'ikZimbabwean
Immigration
NonimmigrantsImmigrantsAfghanistanAfricaAlbaniaArgentinaArmeniaAsiaAustraliaAustriaBahamasBangladeshBarbadosBelarusBelgiumBelizeBoliviaBrazilBulgariaBurma/MyanmarCabo VerdeCambodiaCameroonCanadaCaribbeanCentral AmericaChileChinaColombiaCongoCosta RicaCroatiaCubaCzechoslovakiaDenmarkDominicaDominican RepublicEastern AfricaEastern AsiaEastern EuropeEcuadorEgyptEl SalvadorEnglandEritreaEthiopiaEuropeFijiFranceGermanyGhanaGreeceGrenadaGuatemalaGuyanaHaitiHondurasHong KongHungaryIndiaIndonesiaIranIraqIrelandIsraelItalyJamaicaJapanJordanKazakhstanKenyaKoreaKuwaitLaosLatin AmericaLatviaLebanonLiberiaLithuaniaMalaysiaMexicoMicronesiaMiddle AfricaMoldovaMoroccoNepalNetherlandsNicaraguaNigeriaNorth AmericaNorth MacedoniaNorthern AfricaNorthern EuropeNorwayOceaniaPakistanPanamaPeruPhilippinesPolandPortugalRomaniaRussiaSaudi ArabiaScotlandSenegalSerbiaSierra LeoneSingaporeSomaliaSouth AfricaSouth AmericaSouth Central AsiaSouth Eastern AsiaSouthern EuropeSpainSri LankaSt. Vincent and the GrenadinesSudanSwedenSwitzerlandSyriaTaiwanThailandTrinidad and TobagoTurkeyUgandaUkraineUruguayUzbekistanVenezuelaVietnamWest IndiesWestern AfricaWestern AsiaWestern EuropeYemenZaireZimbabweAzores
Unemployment Among Ages 65 to 74 years
Income
Poverty
Unemployment
Labor Participation
Family Structure
Vehicle Availability
Education Level
Disability

Unemployment Among Ages 65 to 74 years Comparison

Immigrants from Bosnia and Herzegovina

Argentineans

Good
Poor
5.3%
UNEMPLOYMENT AMONG AGES 65 TO 74 YEARS
60.2/ 100
METRIC RATING
165th/ 347
METRIC RANK
5.4%
UNEMPLOYMENT AMONG AGES 65 TO 74 YEARS
14.3/ 100
METRIC RATING
203rd/ 347
METRIC RANK

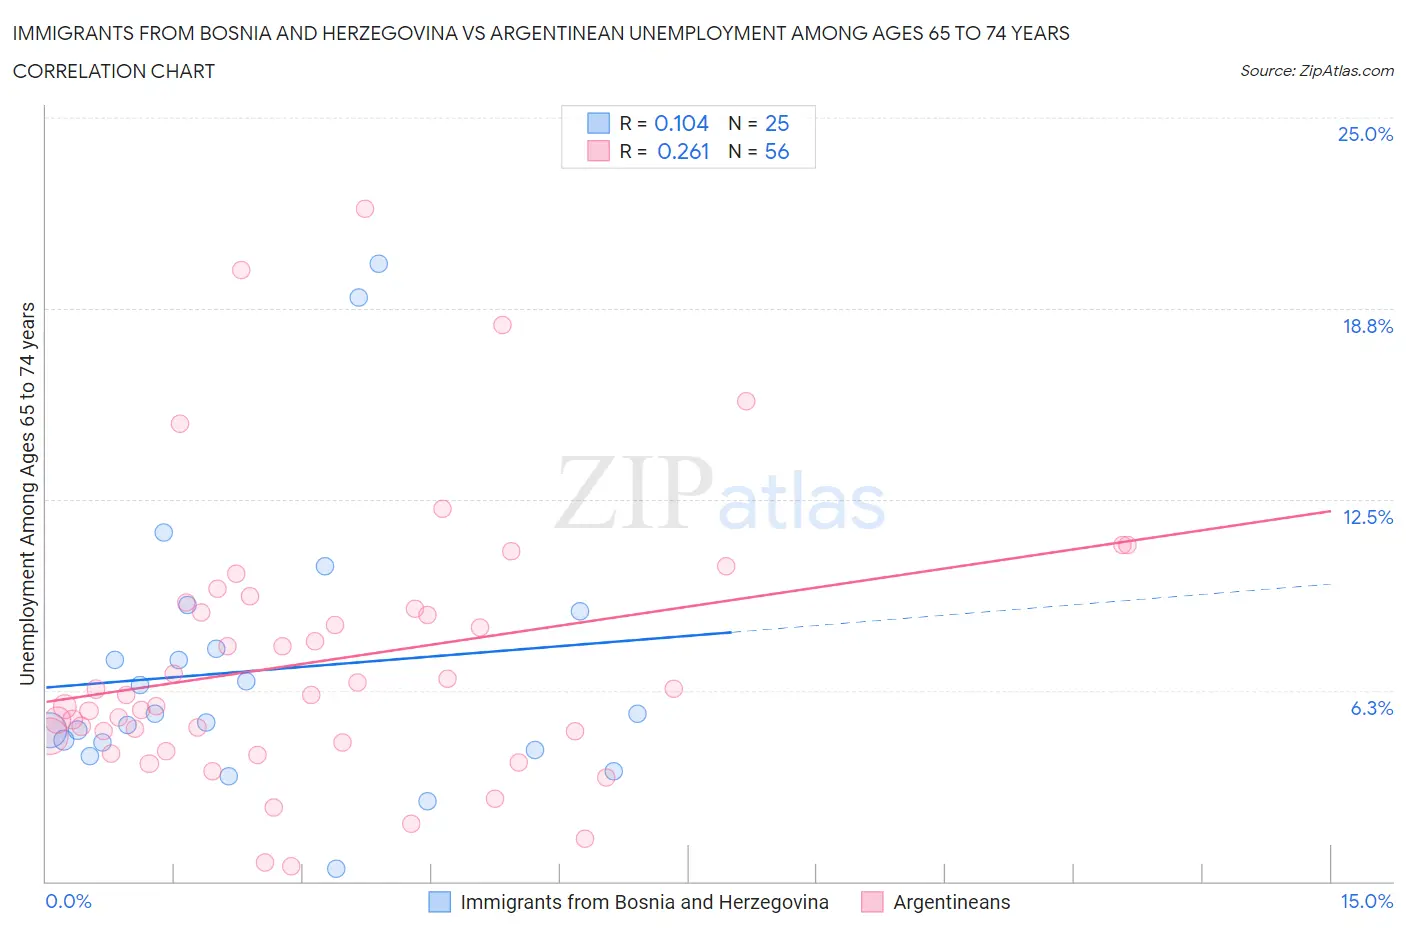
Immigrants from Bosnia and Herzegovina vs Argentinean Unemployment Among Ages 65 to 74 years Correlation Chart

The statistical analysis conducted on geographies consisting of 147,656,848 people shows a poor positive correlation between the proportion of Immigrants from Bosnia and Herzegovina and unemployment rate among population between the ages 65 and 74 in the United States with a correlation coefficient (R) of 0.104 and weighted average of 5.3%. Similarly, the statistical analysis conducted on geographies consisting of 273,128,048 people shows a weak positive correlation between the proportion of Argentineans and unemployment rate among population between the ages 65 and 74 in the United States with a correlation coefficient (R) of 0.261 and weighted average of 5.4%, a difference of 1.8%.
Immigrants from Bosnia and Herzegovina vs Argentinean Unemployment Among Ages 65 to 74 years

Unemployment Among Ages 65 to 74 years Correlation Summary

MeasurementImmigrants from Bosnia and HerzegovinaArgentinean
Minimum0.40%0.50%
Maximum20.2%22.0%
Range19.8%21.5%
Mean6.9%7.2%
Median5.5%6.1%
Interquartile 25% (IQ1)4.4%4.6%
Interquartile 75% (IQ3)8.2%9.0%
Interquartile Range (IQR)3.8%4.4%
Standard Deviation (Sample)4.5%4.4%
Standard Deviation (Population)4.4%4.4%

Similar Demographics by Unemployment Among Ages 65 to 74 years

Demographics Similar to Immigrants from Bosnia and Herzegovina by Unemployment Among Ages 65 to 74 years

In terms of unemployment among ages 65 to 74 years, the demographic groups most similar to Immigrants from Bosnia and Herzegovina are Slovak (5.3%, a difference of 0.010%), Indian (Asian) (5.3%, a difference of 0.010%), Immigrants from Philippines (5.3%, a difference of 0.040%), Immigrants from Eastern Asia (5.3%, a difference of 0.080%), and Mongolian (5.3%, a difference of 0.080%).
DemographicsRating | RankUnemployment Among Ages 65 to 74 years
Immigrants | France
71.0
/100
|
#158
Good
5.3%
Immigrants | Czechoslovakia
66.3
/100
|
#159
Good
5.3%
Bangladeshis
65.8
/100
|
#160
Good
5.3%
Immigrants | Italy
63.7
/100
|
#161
Good
5.3%
Immigrants | Eastern Asia
62.5
/100
|
#162
Good
5.3%
Mongolians
62.3
/100
|
#163
Good
5.3%
Immigrants | Philippines
61.2
/100
|
#164
Good
5.3%
Immigrants | Bosnia and Herzegovina
60.2
/100
|
#165
Good
5.3%
Slovaks
60.0
/100
|
#166
Good
5.3%
Indians (Asian)
59.9
/100
|
#167
Average
5.3%
Whites/Caucasians
57.2
/100
|
#168
Average
5.4%
Laotians
55.7
/100
|
#169
Average
5.4%
Syrians
53.7
/100
|
#170
Average
5.4%
Panamanians
51.8
/100
|
#171
Average
5.4%
Greeks
51.1
/100
|
#172
Average
5.4%

Demographics Similar to Argentineans by Unemployment Among Ages 65 to 74 years

In terms of unemployment among ages 65 to 74 years, the demographic groups most similar to Argentineans are Subsaharan African (5.4%, a difference of 0.0%), Seminole (5.4%, a difference of 0.0%), Icelander (5.4%, a difference of 0.010%), Immigrants from Western Asia (5.4%, a difference of 0.030%), and Immigrants from Pakistan (5.4%, a difference of 0.060%).
DemographicsRating | RankUnemployment Among Ages 65 to 74 years
Costa Ricans
21.1
/100
|
#196
Fair
5.4%
Colville
20.4
/100
|
#197
Fair
5.4%
Albanians
17.8
/100
|
#198
Poor
5.4%
Immigrants | Belgium
16.2
/100
|
#199
Poor
5.4%
Immigrants | Pakistan
15.2
/100
|
#200
Poor
5.4%
Immigrants | Western Asia
14.9
/100
|
#201
Poor
5.4%
Sub-Saharan Africans
14.4
/100
|
#202
Poor
5.4%
Argentineans
14.3
/100
|
#203
Poor
5.4%
Seminole
14.3
/100
|
#204
Poor
5.4%
Icelanders
14.2
/100
|
#205
Poor
5.4%
Africans
12.8
/100
|
#206
Poor
5.5%
Immigrants | Uzbekistan
12.5
/100
|
#207
Poor
5.5%
Dutch West Indians
11.5
/100
|
#208
Poor
5.5%
Immigrants | Honduras
10.4
/100
|
#209
Poor
5.5%
Immigrants | Northern Africa
10.1
/100
|
#210
Poor
5.5%