Immigrants from Belgium vs Iranian Unemployment Among Ages 65 to 74 years
COMPARE
Immigrants from Belgium
Iranian
Unemployment Among Ages 65 to 74 years
Unemployment Among Ages 65 to 74 years Comparison
Immigrants from Belgium
Iranians
5.4%
UNEMPLOYMENT AMONG AGES 65 TO 74 YEARS
16.2/ 100
METRIC RATING
199th/ 347
METRIC RANK
5.2%
UNEMPLOYMENT AMONG AGES 65 TO 74 YEARS
95.2/ 100
METRIC RATING
105th/ 347
METRIC RANK
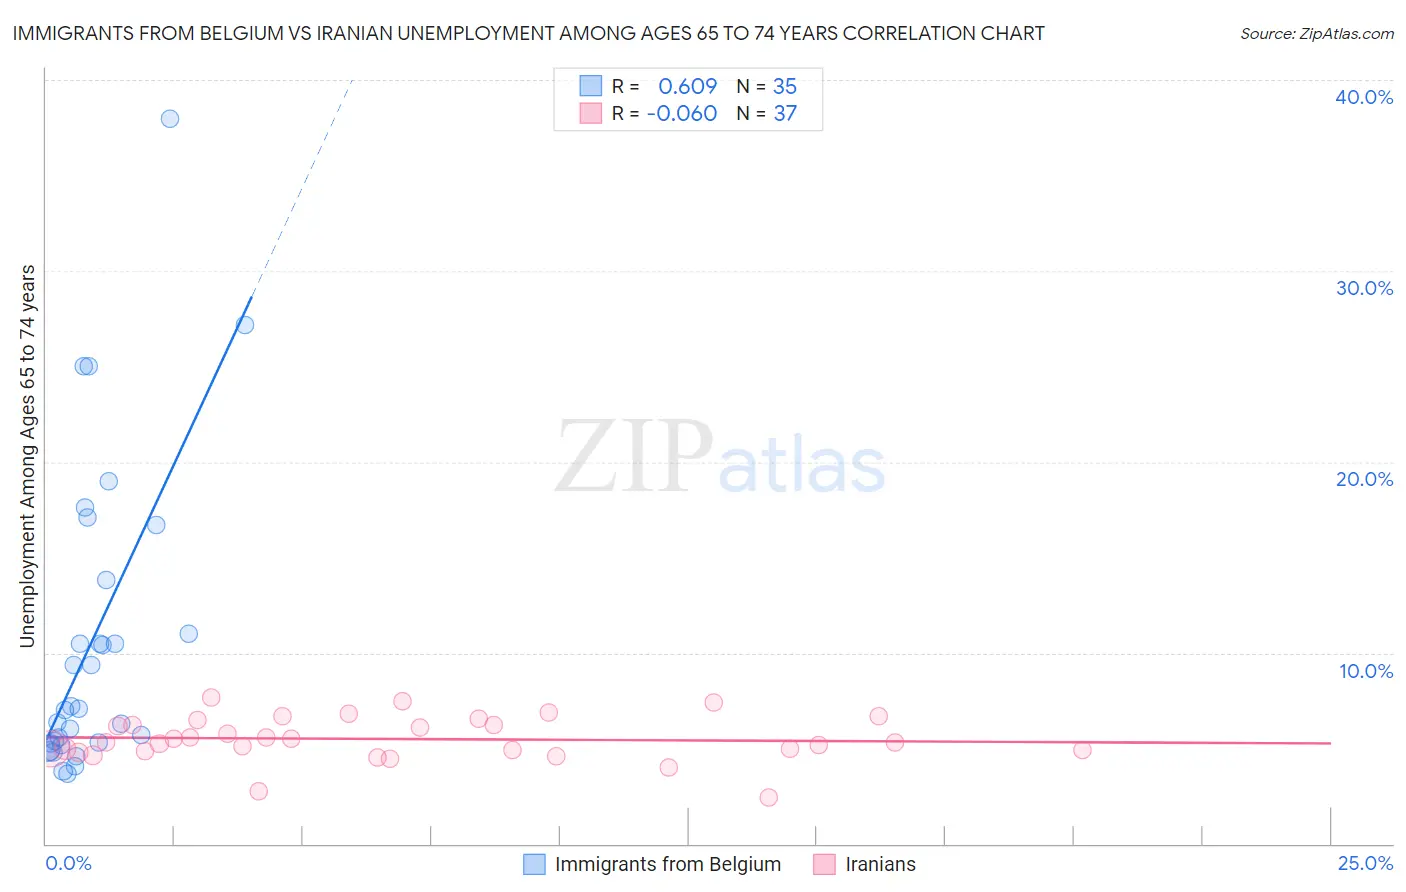
Immigrants from Belgium vs Iranian Unemployment Among Ages 65 to 74 years Correlation Chart
The statistical analysis conducted on geographies consisting of 139,238,535 people shows a significant positive correlation between the proportion of Immigrants from Belgium and unemployment rate among population between the ages 65 and 74 in the United States with a correlation coefficient (R) of 0.609 and weighted average of 5.4%. Similarly, the statistical analysis conducted on geographies consisting of 288,873,217 people shows a slight negative correlation between the proportion of Iranians and unemployment rate among population between the ages 65 and 74 in the United States with a correlation coefficient (R) of -0.060 and weighted average of 5.2%, a difference of 4.0%.
Unemployment Among Ages 65 to 74 years Correlation Summary
| Measurement | Immigrants from Belgium | Iranian |
| Minimum | 3.7% | 2.4% |
| Maximum | 38.0% | 7.6% |
| Range | 34.3% | 5.2% |
| Mean | 10.7% | 5.5% |
| Median | 7.1% | 5.3% |
| Interquartile 25% (IQ1) | 5.3% | 4.9% |
| Interquartile 75% (IQ3) | 13.8% | 6.4% |
| Interquartile Range (IQR) | 8.5% | 1.5% |
| Standard Deviation (Sample) | 8.0% | 1.2% |
| Standard Deviation (Population) | 7.9% | 1.1% |
Similar Demographics by Unemployment Among Ages 65 to 74 years
Demographics Similar to Immigrants from Belgium by Unemployment Among Ages 65 to 74 years
In terms of unemployment among ages 65 to 74 years, the demographic groups most similar to Immigrants from Belgium are Immigrants from Pakistan (5.4%, a difference of 0.060%), Immigrants from Western Asia (5.4%, a difference of 0.080%), Albanian (5.4%, a difference of 0.10%), Subsaharan African (5.4%, a difference of 0.12%), and Argentinean (5.4%, a difference of 0.12%).
| Demographics | Rating | Rank | Unemployment Among Ages 65 to 74 years |
| Maltese | 26.4 /100 | #192 | Fair 5.4% |
| Cherokee | 25.8 /100 | #193 | Fair 5.4% |
| Immigrants | Denmark | 24.7 /100 | #194 | Fair 5.4% |
| Immigrants | China | 24.2 /100 | #195 | Fair 5.4% |
| Costa Ricans | 21.1 /100 | #196 | Fair 5.4% |
| Colville | 20.4 /100 | #197 | Fair 5.4% |
| Albanians | 17.8 /100 | #198 | Poor 5.4% |
| Immigrants | Belgium | 16.2 /100 | #199 | Poor 5.4% |
| Immigrants | Pakistan | 15.2 /100 | #200 | Poor 5.4% |
| Immigrants | Western Asia | 14.9 /100 | #201 | Poor 5.4% |
| Sub-Saharan Africans | 14.4 /100 | #202 | Poor 5.4% |
| Argentineans | 14.3 /100 | #203 | Poor 5.4% |
| Seminole | 14.3 /100 | #204 | Poor 5.4% |
| Icelanders | 14.2 /100 | #205 | Poor 5.4% |
| Africans | 12.8 /100 | #206 | Poor 5.5% |
Demographics Similar to Iranians by Unemployment Among Ages 65 to 74 years
In terms of unemployment among ages 65 to 74 years, the demographic groups most similar to Iranians are Malaysian (5.2%, a difference of 0.020%), Yugoslavian (5.2%, a difference of 0.050%), Immigrants from Vietnam (5.2%, a difference of 0.070%), Austrian (5.2%, a difference of 0.13%), and Immigrants from Lithuania (5.2%, a difference of 0.14%).
| Demographics | Rating | Rank | Unemployment Among Ages 65 to 74 years |
| Welsh | 96.5 /100 | #98 | Exceptional 5.2% |
| Burmese | 96.4 /100 | #99 | Exceptional 5.2% |
| Japanese | 96.4 /100 | #100 | Exceptional 5.2% |
| Immigrants | Cambodia | 96.3 /100 | #101 | Exceptional 5.2% |
| Immigrants | Lithuania | 95.9 /100 | #102 | Exceptional 5.2% |
| Immigrants | Vietnam | 95.6 /100 | #103 | Exceptional 5.2% |
| Yugoslavians | 95.5 /100 | #104 | Exceptional 5.2% |
| Iranians | 95.2 /100 | #105 | Exceptional 5.2% |
| Malaysians | 95.1 /100 | #106 | Exceptional 5.2% |
| Austrians | 94.5 /100 | #107 | Exceptional 5.2% |
| Immigrants | Malaysia | 94.1 /100 | #108 | Exceptional 5.2% |
| Immigrants | Singapore | 93.9 /100 | #109 | Exceptional 5.2% |
| Immigrants | Bolivia | 93.6 /100 | #110 | Exceptional 5.2% |
| Sri Lankans | 92.7 /100 | #111 | Exceptional 5.3% |
| Immigrants | South Central Asia | 92.4 /100 | #112 | Exceptional 5.3% |