Immigrants from Belarus vs Pima Unemployment Among Ages 25 to 29 years
COMPARE
Immigrants from Belarus
Pima
Unemployment Among Ages 25 to 29 years
Unemployment Among Ages 25 to 29 years Comparison
Immigrants from Belarus
Pima
6.5%
UNEMPLOYMENT AMONG AGES 25 TO 29 YEARS
83.7/ 100
METRIC RATING
122nd/ 347
METRIC RANK
11.8%
UNEMPLOYMENT AMONG AGES 25 TO 29 YEARS
0.0/ 100
METRIC RATING
339th/ 347
METRIC RANK
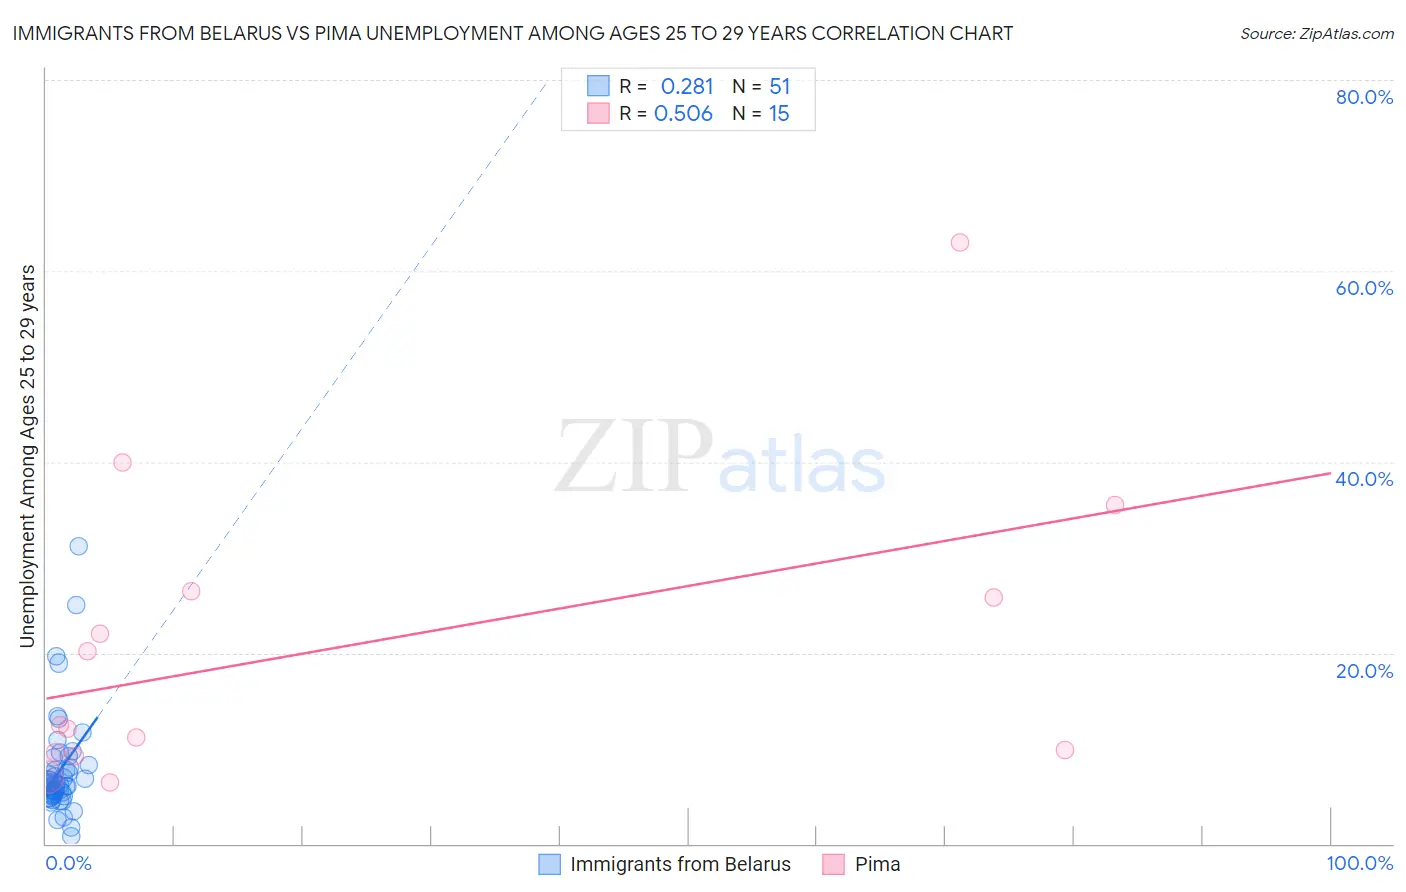
Immigrants from Belarus vs Pima Unemployment Among Ages 25 to 29 years Correlation Chart
The statistical analysis conducted on geographies consisting of 147,163,898 people shows a weak positive correlation between the proportion of Immigrants from Belarus and unemployment rate among population between the ages 25 and 29 in the United States with a correlation coefficient (R) of 0.281 and weighted average of 6.5%. Similarly, the statistical analysis conducted on geographies consisting of 61,065,971 people shows a substantial positive correlation between the proportion of Pima and unemployment rate among population between the ages 25 and 29 in the United States with a correlation coefficient (R) of 0.506 and weighted average of 11.8%, a difference of 81.7%.
Unemployment Among Ages 25 to 29 years Correlation Summary
| Measurement | Immigrants from Belarus | Pima |
| Minimum | 0.80% | 6.4% |
| Maximum | 31.2% | 63.0% |
| Range | 30.4% | 56.6% |
| Mean | 7.8% | 20.7% |
| Median | 6.2% | 12.5% |
| Interquartile 25% (IQ1) | 5.2% | 9.6% |
| Interquartile 75% (IQ3) | 8.3% | 26.5% |
| Interquartile Range (IQR) | 3.1% | 16.9% |
| Standard Deviation (Sample) | 5.5% | 15.7% |
| Standard Deviation (Population) | 5.4% | 15.2% |
Similar Demographics by Unemployment Among Ages 25 to 29 years
Demographics Similar to Immigrants from Belarus by Unemployment Among Ages 25 to 29 years
In terms of unemployment among ages 25 to 29 years, the demographic groups most similar to Immigrants from Belarus are Laotian (6.5%, a difference of 0.020%), Immigrants from Moldova (6.5%, a difference of 0.090%), Immigrants from Uganda (6.5%, a difference of 0.090%), Immigrants from South Africa (6.5%, a difference of 0.14%), and Arab (6.5%, a difference of 0.14%).
| Demographics | Rating | Rank | Unemployment Among Ages 25 to 29 years |
| Macedonians | 86.1 /100 | #115 | Excellent 6.5% |
| Pakistanis | 85.9 /100 | #116 | Excellent 6.5% |
| Immigrants | Uruguay | 85.7 /100 | #117 | Excellent 6.5% |
| Chileans | 85.3 /100 | #118 | Excellent 6.5% |
| Immigrants | South Africa | 84.9 /100 | #119 | Excellent 6.5% |
| Immigrants | Moldova | 84.5 /100 | #120 | Excellent 6.5% |
| Immigrants | Uganda | 84.5 /100 | #121 | Excellent 6.5% |
| Immigrants | Belarus | 83.7 /100 | #122 | Excellent 6.5% |
| Laotians | 83.6 /100 | #123 | Excellent 6.5% |
| Arabs | 82.5 /100 | #124 | Excellent 6.5% |
| Syrians | 82.1 /100 | #125 | Excellent 6.5% |
| Brazilians | 81.9 /100 | #126 | Excellent 6.5% |
| Dutch | 80.6 /100 | #127 | Excellent 6.5% |
| Immigrants | Chile | 80.5 /100 | #128 | Excellent 6.5% |
| Sri Lankans | 80.3 /100 | #129 | Excellent 6.5% |
Demographics Similar to Pima by Unemployment Among Ages 25 to 29 years
In terms of unemployment among ages 25 to 29 years, the demographic groups most similar to Pima are Cheyenne (11.8%, a difference of 0.42%), Sioux (11.7%, a difference of 0.94%), Tohono O'odham (12.1%, a difference of 2.5%), Navajo (12.2%, a difference of 3.4%), and Menominee (11.3%, a difference of 4.5%).
| Demographics | Rating | Rank | Unemployment Among Ages 25 to 29 years |
| Pueblo | 0.0 /100 | #332 | Tragic 10.4% |
| Alaskan Athabascans | 0.0 /100 | #333 | Tragic 10.8% |
| Yuman | 0.0 /100 | #334 | Tragic 11.0% |
| Puerto Ricans | 0.0 /100 | #335 | Tragic 11.1% |
| Lumbee | 0.0 /100 | #336 | Tragic 11.2% |
| Menominee | 0.0 /100 | #337 | Tragic 11.3% |
| Sioux | 0.0 /100 | #338 | Tragic 11.7% |
| Pima | 0.0 /100 | #339 | Tragic 11.8% |
| Cheyenne | 0.0 /100 | #340 | Tragic 11.8% |
| Tohono O'odham | 0.0 /100 | #341 | Tragic 12.1% |
| Navajo | 0.0 /100 | #342 | Tragic 12.2% |
| Inupiat | 0.0 /100 | #343 | Tragic 13.4% |
| Hopi | 0.0 /100 | #344 | Tragic 13.5% |
| Arapaho | 0.0 /100 | #345 | Tragic 15.4% |
| Crow | 0.0 /100 | #346 | Tragic 15.4% |