Immigrants from Barbados vs Yup'ik Unemployment Among Ages 25 to 29 years
COMPARE
Immigrants from Barbados
Yup'ik
Unemployment Among Ages 25 to 29 years
Unemployment Among Ages 25 to 29 years Comparison
Immigrants from Barbados
Yup'ik
8.0%
UNEMPLOYMENT AMONG AGES 25 TO 29 YEARS
0.0/ 100
METRIC RATING
307th/ 347
METRIC RANK
17.9%
UNEMPLOYMENT AMONG AGES 25 TO 29 YEARS
0.0/ 100
METRIC RATING
347th/ 347
METRIC RANK
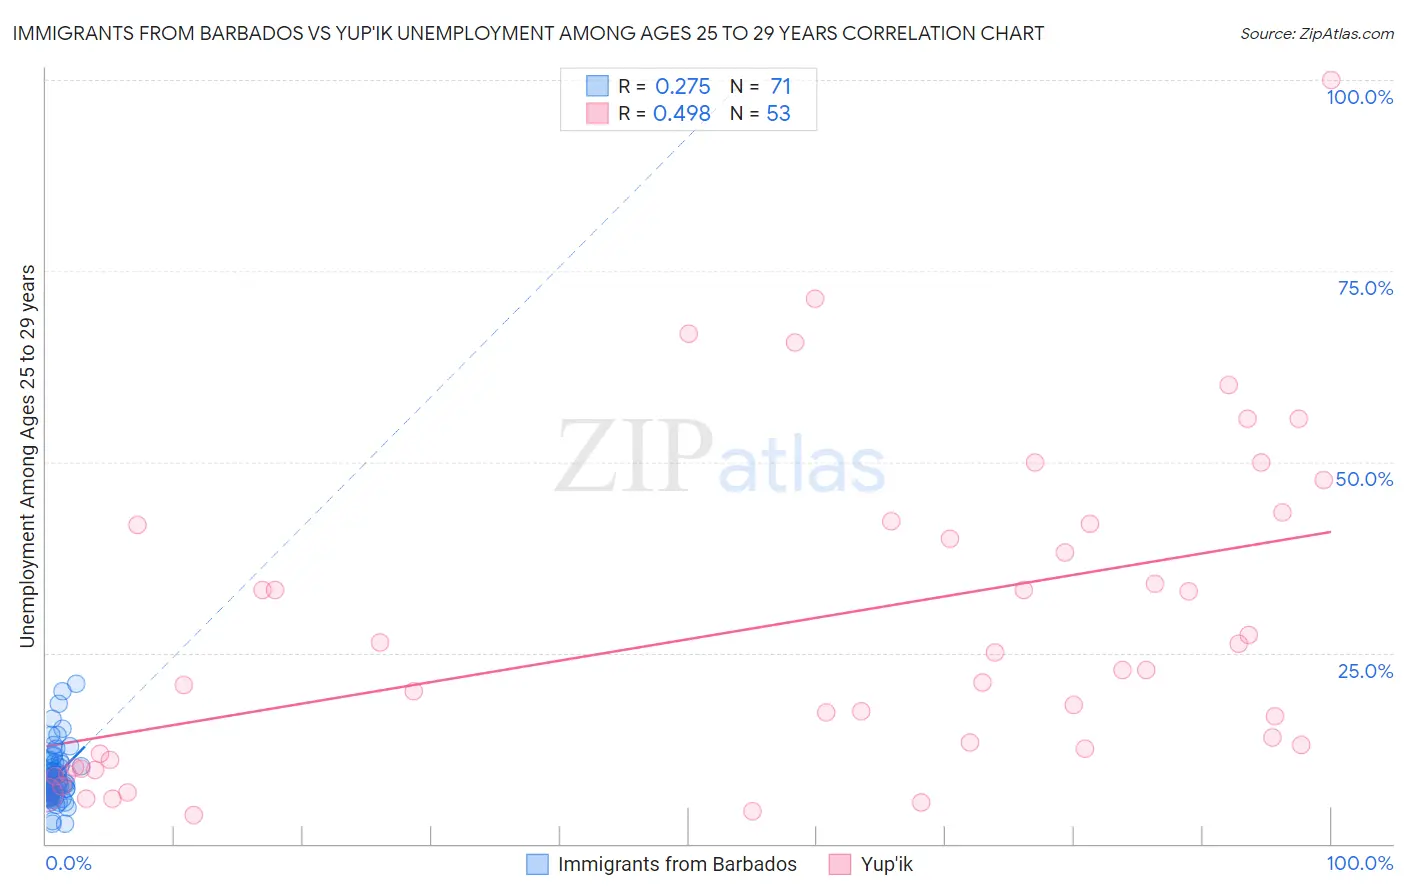
Immigrants from Barbados vs Yup'ik Unemployment Among Ages 25 to 29 years Correlation Chart
The statistical analysis conducted on geographies consisting of 111,437,258 people shows a weak positive correlation between the proportion of Immigrants from Barbados and unemployment rate among population between the ages 25 and 29 in the United States with a correlation coefficient (R) of 0.275 and weighted average of 8.0%. Similarly, the statistical analysis conducted on geographies consisting of 39,381,605 people shows a moderate positive correlation between the proportion of Yup'ik and unemployment rate among population between the ages 25 and 29 in the United States with a correlation coefficient (R) of 0.498 and weighted average of 17.9%, a difference of 122.6%.
Unemployment Among Ages 25 to 29 years Correlation Summary
| Measurement | Immigrants from Barbados | Yup'ik |
| Minimum | 2.6% | 3.8% |
| Maximum | 21.0% | 100.0% |
| Range | 18.4% | 96.2% |
| Mean | 8.8% | 28.1% |
| Median | 8.1% | 22.7% |
| Interquartile 25% (IQ1) | 6.7% | 10.5% |
| Interquartile 75% (IQ3) | 10.2% | 41.8% |
| Interquartile Range (IQR) | 3.5% | 31.3% |
| Standard Deviation (Sample) | 3.6% | 21.0% |
| Standard Deviation (Population) | 3.5% | 20.8% |
Similar Demographics by Unemployment Among Ages 25 to 29 years
Demographics Similar to Immigrants from Barbados by Unemployment Among Ages 25 to 29 years
In terms of unemployment among ages 25 to 29 years, the demographic groups most similar to Immigrants from Barbados are Haitian (8.0%, a difference of 0.16%), Tsimshian (8.0%, a difference of 0.24%), Immigrants from Jamaica (8.1%, a difference of 0.42%), Immigrants from Haiti (8.1%, a difference of 0.43%), and U.S. Virgin Islander (8.1%, a difference of 0.44%).
| Demographics | Rating | Rank | Unemployment Among Ages 25 to 29 years |
| Central American Indians | 0.0 /100 | #300 | Tragic 7.9% |
| West Indians | 0.0 /100 | #301 | Tragic 7.9% |
| Jamaicans | 0.0 /100 | #302 | Tragic 7.9% |
| Immigrants | Yemen | 0.0 /100 | #303 | Tragic 8.0% |
| Cajuns | 0.0 /100 | #304 | Tragic 8.0% |
| Tsimshian | 0.0 /100 | #305 | Tragic 8.0% |
| Haitians | 0.0 /100 | #306 | Tragic 8.0% |
| Immigrants | Barbados | 0.0 /100 | #307 | Tragic 8.0% |
| Immigrants | Jamaica | 0.0 /100 | #308 | Tragic 8.1% |
| Immigrants | Haiti | 0.0 /100 | #309 | Tragic 8.1% |
| U.S. Virgin Islanders | 0.0 /100 | #310 | Tragic 8.1% |
| Immigrants | Azores | 0.0 /100 | #311 | Tragic 8.1% |
| Dutch West Indians | 0.0 /100 | #312 | Tragic 8.2% |
| Immigrants | St. Vincent and the Grenadines | 0.0 /100 | #313 | Tragic 8.4% |
| Immigrants | Dominica | 0.0 /100 | #314 | Tragic 8.4% |
Demographics Similar to Yup'ik by Unemployment Among Ages 25 to 29 years
In terms of unemployment among ages 25 to 29 years, the demographic groups most similar to Yup'ik are Crow (15.4%, a difference of 16.6%), Arapaho (15.4%, a difference of 16.6%), Hopi (13.5%, a difference of 32.6%), Inupiat (13.4%, a difference of 33.4%), and Navajo (12.2%, a difference of 47.2%).
| Demographics | Rating | Rank | Unemployment Among Ages 25 to 29 years |
| Alaskan Athabascans | 0.0 /100 | #333 | Tragic 10.8% |
| Yuman | 0.0 /100 | #334 | Tragic 11.0% |
| Puerto Ricans | 0.0 /100 | #335 | Tragic 11.1% |
| Lumbee | 0.0 /100 | #336 | Tragic 11.2% |
| Menominee | 0.0 /100 | #337 | Tragic 11.3% |
| Sioux | 0.0 /100 | #338 | Tragic 11.7% |
| Pima | 0.0 /100 | #339 | Tragic 11.8% |
| Cheyenne | 0.0 /100 | #340 | Tragic 11.8% |
| Tohono O'odham | 0.0 /100 | #341 | Tragic 12.1% |
| Navajo | 0.0 /100 | #342 | Tragic 12.2% |
| Inupiat | 0.0 /100 | #343 | Tragic 13.4% |
| Hopi | 0.0 /100 | #344 | Tragic 13.5% |
| Arapaho | 0.0 /100 | #345 | Tragic 15.4% |
| Crow | 0.0 /100 | #346 | Tragic 15.4% |
| Yup'ik | 0.0 /100 | #347 | Tragic 17.9% |