Immigrants from Barbados vs Immigrants from Venezuela Unemployment Among Ages 16 to 19 years
COMPARE
Immigrants from Barbados
Immigrants from Venezuela
Unemployment Among Ages 16 to 19 years
Unemployment Among Ages 16 to 19 years Comparison
Immigrants from Barbados
Immigrants from Venezuela
24.0%
UNEMPLOYMENT AMONG AGES 16 TO 19 YEARS
0.0/ 100
METRIC RATING
332nd/ 347
METRIC RANK
16.9%
UNEMPLOYMENT AMONG AGES 16 TO 19 YEARS
95.3/ 100
METRIC RATING
97th/ 347
METRIC RANK
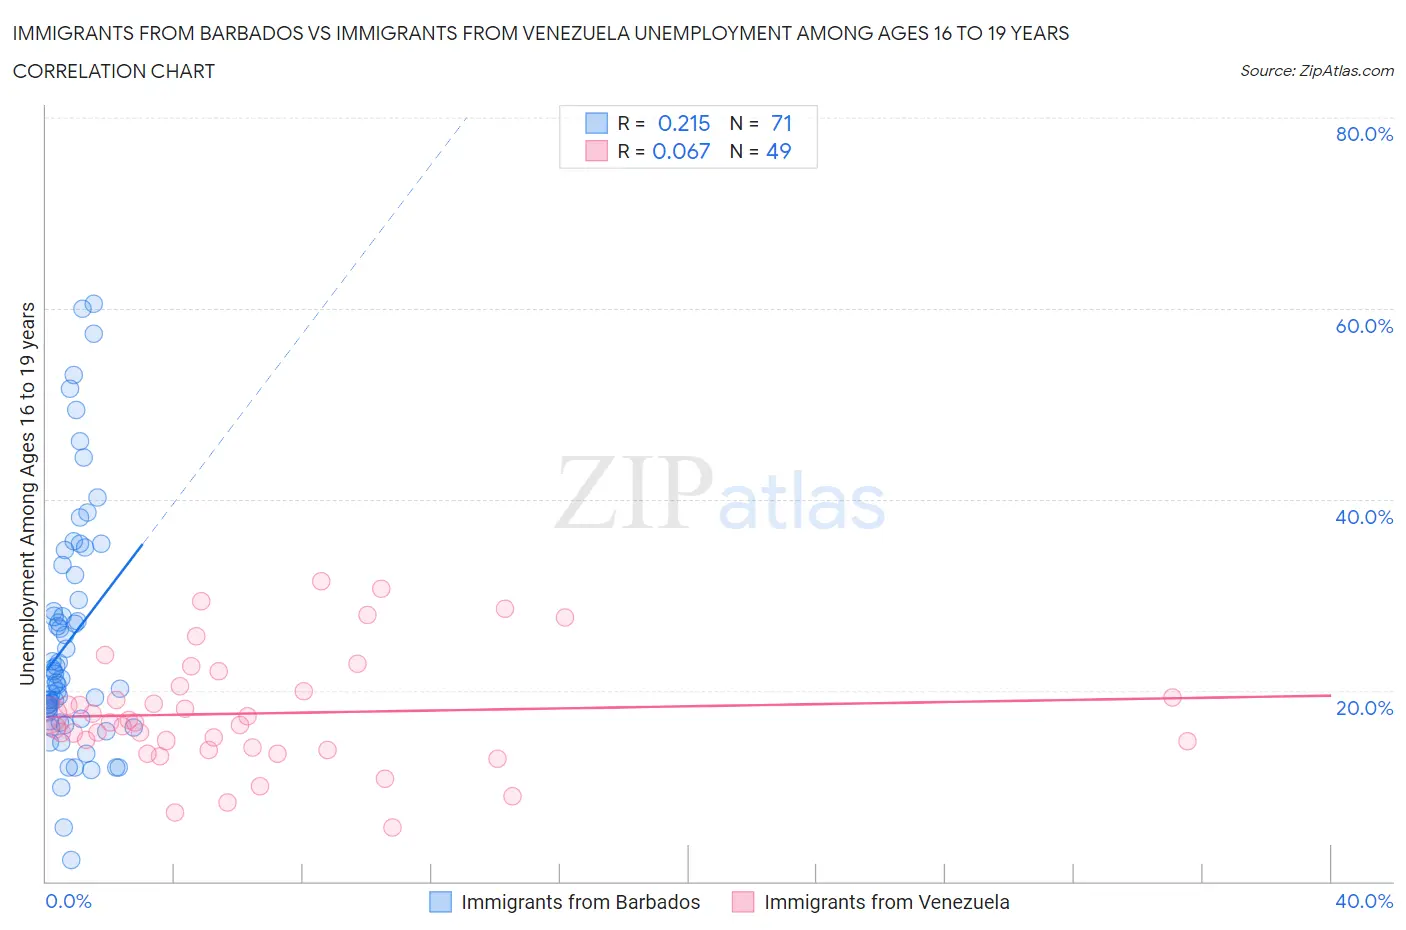
Immigrants from Barbados vs Immigrants from Venezuela Unemployment Among Ages 16 to 19 years Correlation Chart
The statistical analysis conducted on geographies consisting of 110,917,290 people shows a weak positive correlation between the proportion of Immigrants from Barbados and unemployment rate among population between the ages 16 and 19 in the United States with a correlation coefficient (R) of 0.215 and weighted average of 24.0%. Similarly, the statistical analysis conducted on geographies consisting of 277,495,072 people shows a slight positive correlation between the proportion of Immigrants from Venezuela and unemployment rate among population between the ages 16 and 19 in the United States with a correlation coefficient (R) of 0.067 and weighted average of 16.9%, a difference of 41.7%.
Unemployment Among Ages 16 to 19 years Correlation Summary
| Measurement | Immigrants from Barbados | Immigrants from Venezuela |
| Minimum | 2.2% | 5.6% |
| Maximum | 60.5% | 31.5% |
| Range | 58.3% | 25.9% |
| Mean | 25.3% | 17.6% |
| Median | 21.2% | 16.6% |
| Interquartile 25% (IQ1) | 17.0% | 13.9% |
| Interquartile 75% (IQ3) | 32.1% | 20.2% |
| Interquartile Range (IQR) | 15.1% | 6.2% |
| Standard Deviation (Sample) | 12.7% | 6.0% |
| Standard Deviation (Population) | 12.6% | 5.9% |
Similar Demographics by Unemployment Among Ages 16 to 19 years
Demographics Similar to Immigrants from Barbados by Unemployment Among Ages 16 to 19 years
In terms of unemployment among ages 16 to 19 years, the demographic groups most similar to Immigrants from Barbados are British West Indian (24.0%, a difference of 0.17%), Paiute (24.4%, a difference of 1.4%), Dominican (23.6%, a difference of 1.6%), Tlingit-Haida (23.5%, a difference of 2.0%), and Immigrants from Dominican Republic (23.3%, a difference of 3.1%).
| Demographics | Rating | Rank | Unemployment Among Ages 16 to 19 years |
| Trinidadians and Tobagonians | 0.0 /100 | #325 | Tragic 22.6% |
| Immigrants | Trinidad and Tobago | 0.0 /100 | #326 | Tragic 23.1% |
| Pima | 0.0 /100 | #327 | Tragic 23.1% |
| Immigrants | Dominican Republic | 0.0 /100 | #328 | Tragic 23.3% |
| Tlingit-Haida | 0.0 /100 | #329 | Tragic 23.5% |
| Dominicans | 0.0 /100 | #330 | Tragic 23.6% |
| British West Indians | 0.0 /100 | #331 | Tragic 24.0% |
| Immigrants | Barbados | 0.0 /100 | #332 | Tragic 24.0% |
| Paiute | 0.0 /100 | #333 | Tragic 24.4% |
| Guyanese | 0.0 /100 | #334 | Tragic 24.8% |
| Arapaho | 0.0 /100 | #335 | Tragic 25.2% |
| Kiowa | 0.0 /100 | #336 | Tragic 25.2% |
| Immigrants | Guyana | 0.0 /100 | #337 | Tragic 25.5% |
| Immigrants | St. Vincent and the Grenadines | 0.0 /100 | #338 | Tragic 25.7% |
| Immigrants | Grenada | 0.0 /100 | #339 | Tragic 25.7% |
Demographics Similar to Immigrants from Venezuela by Unemployment Among Ages 16 to 19 years
In terms of unemployment among ages 16 to 19 years, the demographic groups most similar to Immigrants from Venezuela are Ottawa (16.9%, a difference of 0.030%), Mongolian (16.9%, a difference of 0.060%), Burmese (17.0%, a difference of 0.10%), Immigrants from Lithuania (17.0%, a difference of 0.12%), and Bangladeshi (16.9%, a difference of 0.13%).
| Demographics | Rating | Rank | Unemployment Among Ages 16 to 19 years |
| Asians | 96.6 /100 | #90 | Exceptional 16.9% |
| Cambodians | 96.3 /100 | #91 | Exceptional 16.9% |
| South Africans | 95.9 /100 | #92 | Exceptional 16.9% |
| Cubans | 95.8 /100 | #93 | Exceptional 16.9% |
| Bangladeshis | 95.8 /100 | #94 | Exceptional 16.9% |
| Mongolians | 95.6 /100 | #95 | Exceptional 16.9% |
| Ottawa | 95.4 /100 | #96 | Exceptional 16.9% |
| Immigrants | Venezuela | 95.3 /100 | #97 | Exceptional 16.9% |
| Burmese | 95.0 /100 | #98 | Exceptional 17.0% |
| Immigrants | Lithuania | 94.9 /100 | #99 | Exceptional 17.0% |
| Immigrants | Thailand | 94.7 /100 | #100 | Exceptional 17.0% |
| Immigrants | Saudi Arabia | 94.7 /100 | #101 | Exceptional 17.0% |
| Immigrants | Pakistan | 94.6 /100 | #102 | Exceptional 17.0% |
| Palestinians | 94.6 /100 | #103 | Exceptional 17.0% |
| Italians | 94.5 /100 | #104 | Exceptional 17.0% |